
|
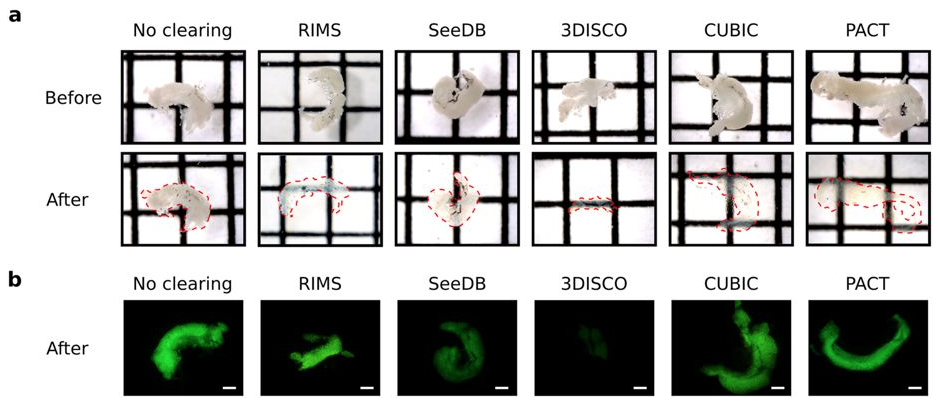
Fig. 1
Testes were dissected from the zebrafish transgenic line Tg(gsdf:GFP) and cleared with RIMS, SeeDB, 3DISCO, CUBIC or PACT protocols. Testes were incubated in the refractive index matching solution of the last step of each protocol and imaged within 1 day. (a) Brightfield images of testes before and after clearing with the indicated methods. Transparency is assessed by the visualization of black lines situated underneath each sample. Dotted red line indicates the edge of testes after clearing. Square = 1.6 mm × 1.6 mm. (b) GFP fluorescence of cleared and non-cleared testes. The different clearing protocols used are indicated. Scale bar: 500 μm.