
- Title
-
Zebrafish fin regeneration after cryoinjury-induced tissue damage
- Authors
- Chassot, B., Pury, D., Jaźwińska, A.
- Source
- Full text @ Biol. Open
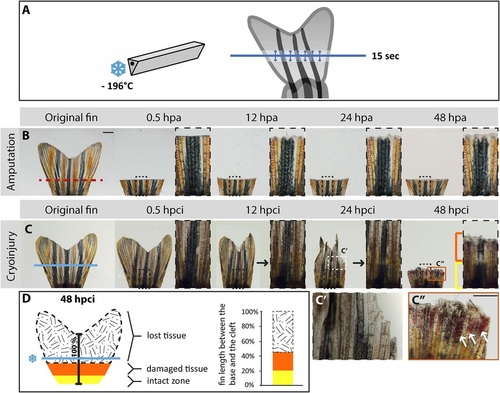
Cryoinjury of the caudal fin results in spontaneous sloughing of destroyed tissue within two days after the damage induction. (A) Schematic representation of the cryoinjury procedure. The cryotome blade (left side) was precooled in liquid nitrogen, and gently placed just above the fin (right side) for 15s at the position demarcated by the blue line. The arrows indicate spreading of the cold from the blade in the adjacent tissue. (B,C) Time-lapse images of the caudal fin after amputation (B) and cryoinjury (C) showing the appendage before injury, and at 0.5h, 12h, 24h and 48h after the procedure; hpa, hours post-amputation; hpci, hours post-cryoinjury. As opposed to the transection model (B), in which a part of the fin is immediately removed from the amputation plane (red dashed line), the non-surgical exposure to the cold (C) along the cryoinjury plane (blue line) results in a progressive tissue detachment that is apparent between 12 and 48hpci. At 48hpa (B), the initiation of regeneration is detected by the presence of a whitish tissue containing the blastema and wound epidermis. At 48hpci (C), the distal part of the stump contains a partially damaged tissue zone (orange bracket and frame) with affected pigmentation, blood clots and broken bones. The intact zone is restricted to the base of the fin (yellow bracket). Black arrows at 12 and 24hpci indicate the plane with fading pigmentation. (C′) Magnified image of the white dashed line-framed area shown in above panel at 24hpci. (C′′) Magnification of the orange line-framed area shown in above panel at 48hpci. White arrows indicate blood clots. (D) Schematic representation of the tissue damage after cryoinjury at 48hpci, normalized to the distance between the base of the fin and the central cleft. The black-white patterned area corresponds to the sloughed part of the original fin. The remaining fin comprises partially damaged tissue (orange) and an intact stump (yellow). N=6. Scale bar in B=1mm; C′′=100µm. |
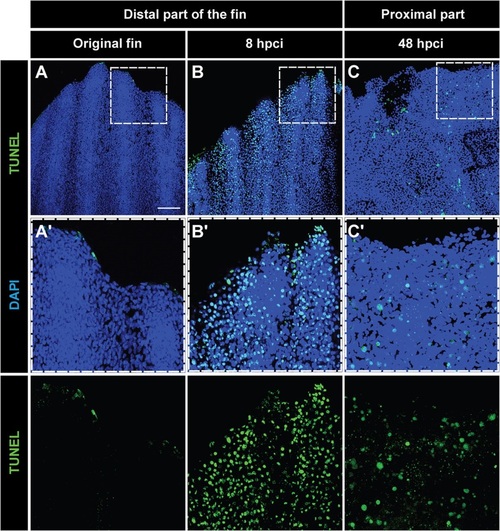
Tissue loss after cryoinjury is associated with massive apoptosis. (A-C) Whole-mount staining with DAPI (blue) and TUNEL (green) of the original fin (A), at 8hpci (B) and at 48hpci (C). (A′-C′) Magnifications of the framed areas of the upper images. (A,A′) Uninjured fins contain few apoptotic cells at the distal margin. (B,B2) Before sloughing of the cryoinjured fin part at 8hpci, extensive apoptosis in the distal part of the extremity is observed. (C,C′) After truncation of the damaged fin part at 48hpci, the margin of the remaining stump still contains apoptotic cells. N=4. Scale bar in A=100µm. |
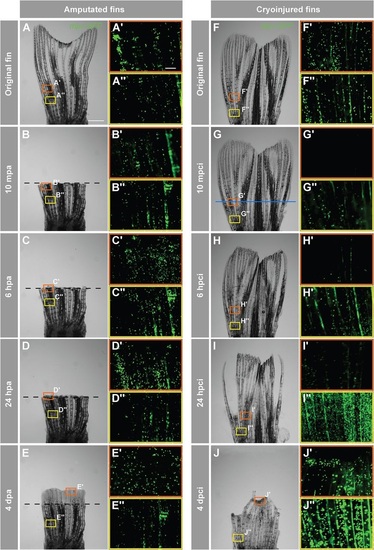
Accumulation of neutrophils in the damaged tissue indicates an acute inflammatory response after cryoinjury. In-vivo visualization of neutrophils in Tg(mpx:GFP) fish. (A-J) Time-lapse bright-field images of the same fins after amputation (A-E) and cryoinjury (F-J). Frames indicate the regions selected for fluorescence imaging of GFP-positive neutrophils, depicted in A′-E′′,F′-J′′ Middle region of the fin (orange box) at the level of the amputation plane (dashed line) and cryoinjury plane (blue line). The proximal part of the fin (yellow frame) that is remote from the injury site. In the amputation model (A-E), no change in the distribution of neutrophils is observed at either the amputation plane or proximal site (A′-E′′). After cryoinjury (F-J), neutrophils at the site of injury are destroyed (G′,H′), and they start to repopulate the stump margin at 24hpci (I2) to reach normal distribution at 4dpci (J′′). The proximal intact stump comprises markedly increased numbers of neutrophils at 24hpci (I′′) and 4dpci (J′′). mpa, minutes post-amputation; mpci, minutes post-cryoinjury. N=4. Scale bar in A=1mm, in A′=100µm. |
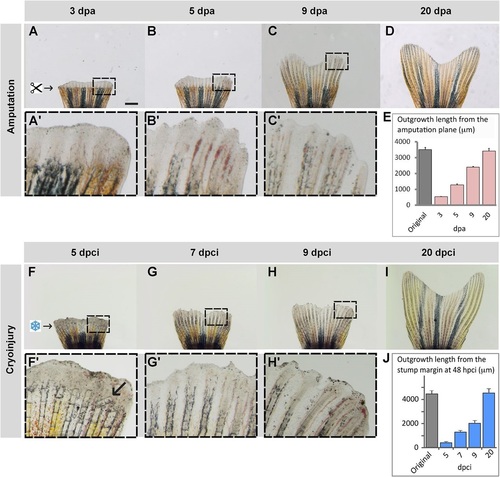
Truncation of the damaged fin tissue is followed by resumed regeneration. (A-D) Time-lapse imaging of fins after amputation during the outgrowth-formation, with boxed areas magnified in A′-C′. (F-I) Time-lapse imaging of fins after cryoinjury during the regenerative phase, with boxed areas magnified in F′-H′. Despite a delay of fin loss and partial damage of the stump, the regenerate reproduces a normal shape of the original fin within 20days. (F2) Arrow indicates a broken bone. (E,J) Quantification of the fin regeneration after amputation (E) and cryoinjury (J). The length of the 3 longest lateral rays was measured from the stump margin after fin loss to the distal tip of the regenerate at different time-points. Error bars represent s.e.m., N=4 fins. Scale bar in A=1mm. |
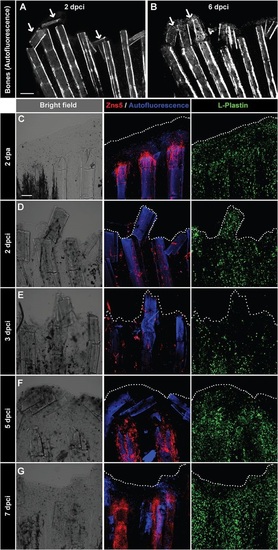
Detachment of the destroyed fin tissue is associated with displacement and resorption of the dead bone fragments at the wound margin. (A,B) Imaging of bones in the same fin detected by autofluorescence of the mineralized matrix at 2 and 6dpci. The margin of the remnant fins contains detached and displaced bone fragments between the rays that become resolved (arrows). N=5. (C-G) Confocal imaging of whole-mount fins immunostained with the osteoblast marker Zns5 (red), phagocyte marker L-plastin (green) and autofluorescent bone matrix (blue) at 2dpa (C) and at different time points after cryoinjury (D-G). At 2dpa (C), Zns5-labelled osteoblasts accumulate at the tip of the bone to initiate bone regeneration. L-plastin-expressing cells are present in the entire tissue. At 2dpci (D) and 3dpci (E), osteoblasts are scattered along the bones in irregular manner. At 5dpci (F), Zns5-positive cells are enriched at the tips of the intact bones, below the margin of the stump that contains bone debris devoid of osteoblasts. At 7dpci (G), Zns5 immunostaining is robustly enhanced along the remaining bones, indicating resumed regeneration. L-plastin-expressing cells are associated with the repairing and regenerating tissue. N=4. Scale bar in A=200µm, in C=100µm. |
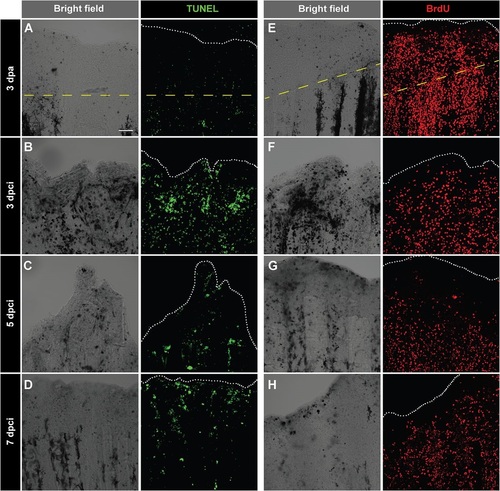
Enhanced cell proliferation and upregulation of tissue remodelling protein during regeneration of cryoinjured fins. (A-D) TUNEL labelling (green) of whole-mount fins at 3dpa (A) and at different time points after cryoinjury (B-D). At 3dpa (A), TUNEL staining is nearly absent. At 3dpci (B), 5dpci (C) and 7dpci (D), tissue debris (dark structures in bright-field images) are associated with TUNEL-positive cells. (E-H) Immunodetection of BrdU (red) in whole-mount caudal fins at 3dpa (E) and at different time points after cryoinjury (F-H). As compared to 3dpa (E), BrdU-incorporation is lower in cryoinjured fins at 3dpci (F), especially at the position of necrotic cells (dark regions in the bright-field). Cell proliferation becomes more abundant at 5dpci (G) and 7dpci (H). The dashed yellow line indicates the plane of amputation. The edge of the fin is indicated with a white dotted line. N=5. Scale bar=100µm. |
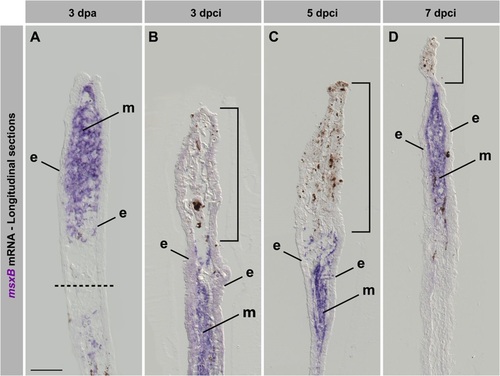
The blastemal marker msxB is upregulated in regenerating fins after cryoinjury. (A-D) In situ hybridization of longitudinal fin sections using msxB antisense probe (purple) at 3dpa (A) and different time points after cryoinjury (B-D). Dashed line indicates the amputation plane. Bracket indicates the damaged tissue remaining in the cryoinjured stump. In the amputation model, msxB is upregulated in the mesenchyme of the outgrowth. After cryoinjury, msxB expression is induced below the damaged tissue. At 7dpci (D), a normal blastema is formed, despite small amounts of distally remaining tissue debris. e, epidermis; m, mesenchyme. N=4. Scale bar=100µm. |
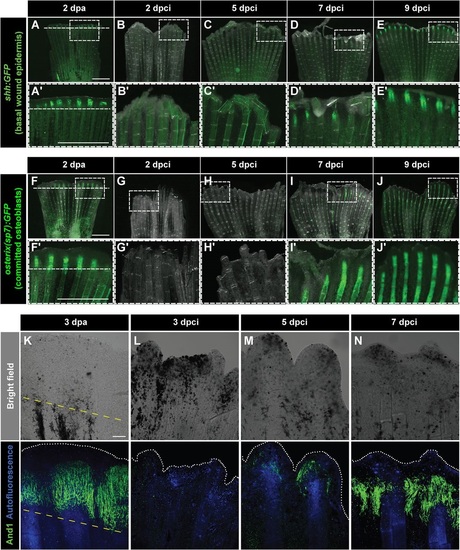
Dynamics of bone and actinotrichia regeneration in cryoinjured fins. (A-E′) Live-imaging of shh:GFP transgenic fish demarcates a subset of cells in the basal layer of the lateral wound epidermis (green) at 2dpa (A) different time points after cryoinjury (B-E). Dashed line indicates the plane of amputation. The expression of shh:GFP becomes detectable starting at 7dpci (D,D′), indicating organization and subdivision of the basal epithelium. N=4. Boxes in A-E magnified in A′-E′. (F-J′) Live-imaging of transgenic fish osterix(sp7):GFP highlights intermediately differentiated osteoblasts (green) at 2dpa (F) and at different time points after cryoinjury (G-J). The expression of osterix(sp7):GFP becomes detectable starting at 7dpci (I,I′), indicating bone regeneration. N=4. Boxes in F-J magnified in F′-J′. (K-N) Bright-field (upper panels) and confocal (lower panels) images of whole-mount fins immunostained with anti-And1 antibodies (green) at 3dpa (K) and at different times after cryoinjury (L-N). Bone matrix is detected by autofluorescence (blue). The bright-field images show dark necrotic tissue at the margin of cryoinjured fins. The expression of And1 starts at 5dpci (M) and becomes more evident at 7dpci (N). N=4. Yellow dashed line indicates the amputation plane. Scale bar in A=1mm and in K=100µm. |
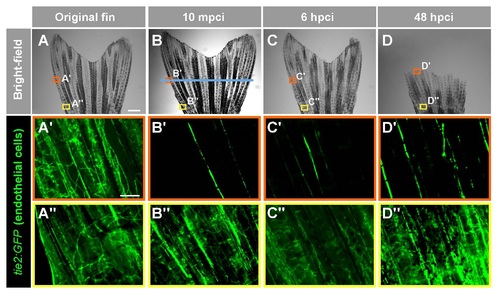
Cryoinjury damages endothelial cells of blood vessels, resulting in the interrupted blood supply in the fin. (A-C) Live-imaging of the vasculature in the Tg(tie2:GFP) fish. (A) Brigthfield imaging of the original fin at 10 mpci, 6 hpci and 48 hpci. Cyoinjury plane is indicated with the blue line. (B-C) Fluorescence imaging of the framed areas shown in the upper images respective the color code. Scale bar in (A) = 1 mm, in (B) = 100 µm. |
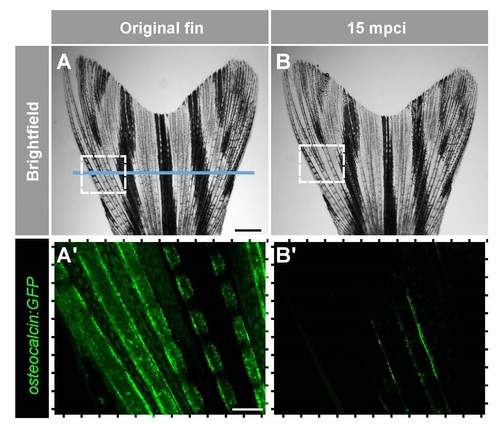
Damage of the mature osteoblasts along the cryoinjury plane. Live-imaging of mature osteoblasts along the bony rays of Tg(osteocalcin:GFP) fish. (A) Brigthfield imaging of the same fin before injury and at 15 mpci. Croyinjury plane is indicated with the blue line. (B) Fluorescence imaging of the framed areas shown in the upper images. Scale bar in (A), 1 mm; in (B), 250 µm. |