
|
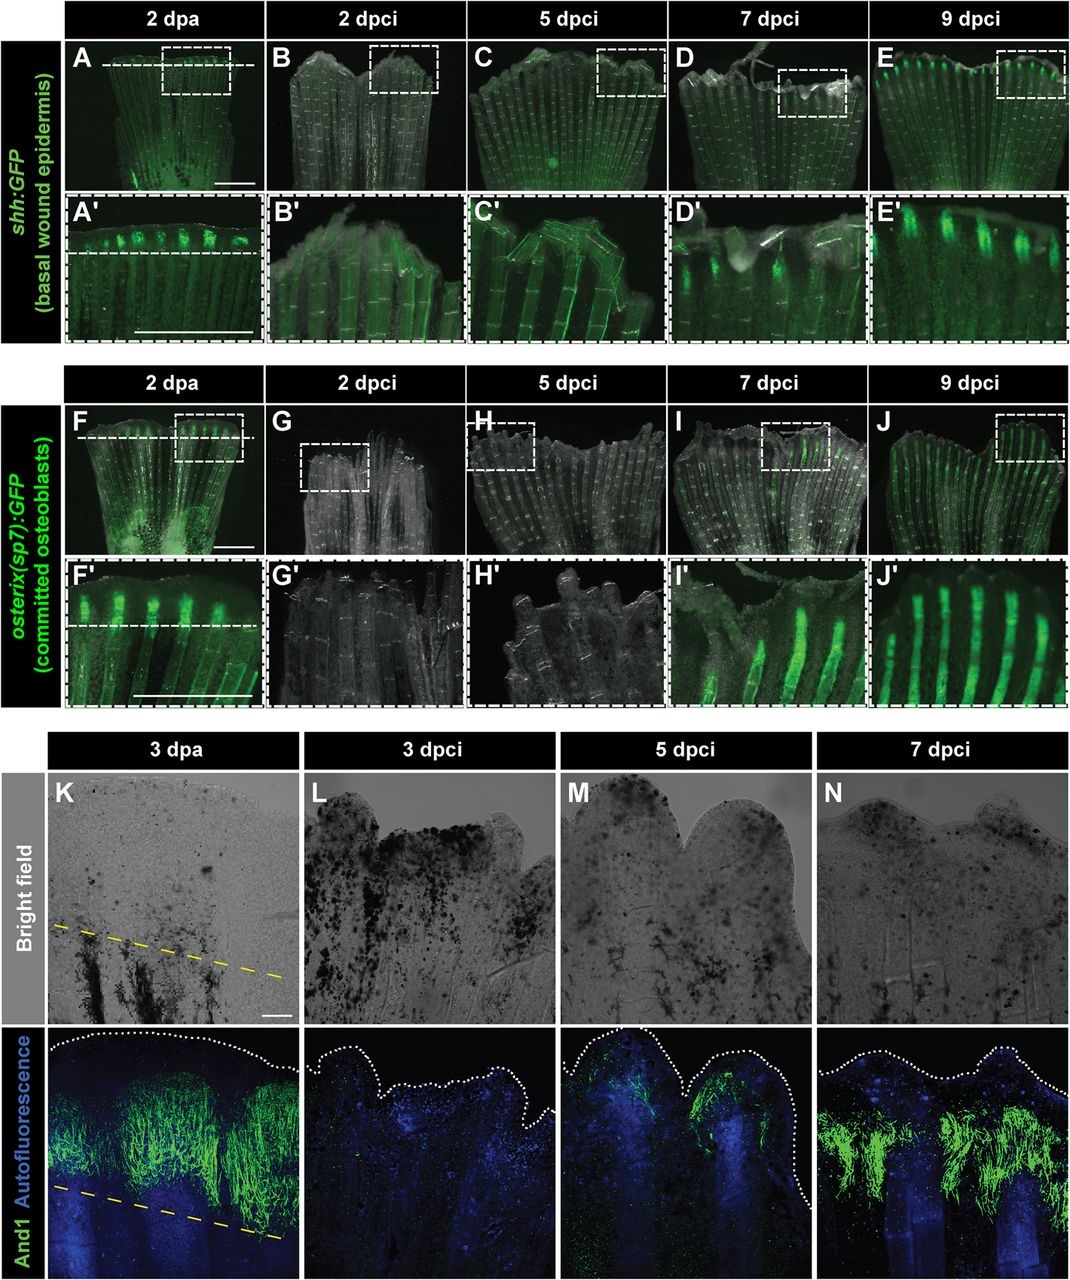
Fig. 8
Dynamics of bone and actinotrichia regeneration in cryoinjured fins. (A-E′) Live-imaging of shh:GFP transgenic fish demarcates a subset of cells in the basal layer of the lateral wound epidermis (green) at 2dpa (A) different time points after cryoinjury (B-E). Dashed line indicates the plane of amputation. The expression of shh:GFP becomes detectable starting at 7dpci (D,D′), indicating organization and subdivision of the basal epithelium. N=4. Boxes in A-E magnified in A′-E′. (F-J′) Live-imaging of transgenic fish osterix(sp7):GFP highlights intermediately differentiated osteoblasts (green) at 2dpa (F) and at different time points after cryoinjury (G-J). The expression of osterix(sp7):GFP becomes detectable starting at 7dpci (I,I′), indicating bone regeneration. N=4. Boxes in F-J magnified in F′-J′. (K-N) Bright-field (upper panels) and confocal (lower panels) images of whole-mount fins immunostained with anti-And1 antibodies (green) at 3dpa (K) and at different times after cryoinjury (L-N). Bone matrix is detected by autofluorescence (blue). The bright-field images show dark necrotic tissue at the margin of cryoinjured fins. The expression of And1 starts at 5dpci (M) and becomes more evident at 7dpci (N). N=4. Yellow dashed line indicates the amputation plane. Scale bar in A=1mm and in K=100µm.