
|
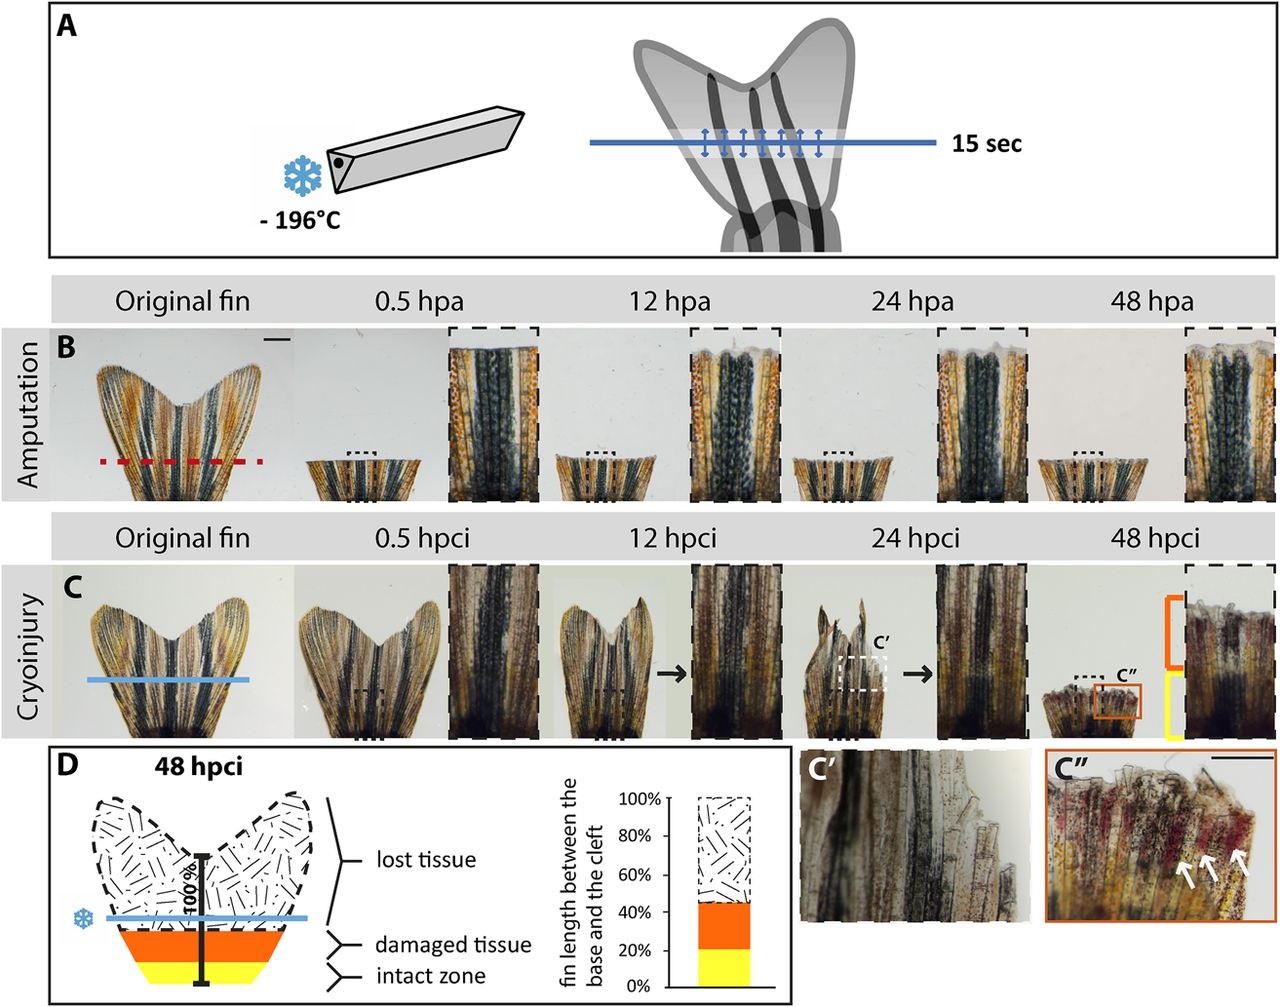
Fig. 1
Cryoinjury of the caudal fin results in spontaneous sloughing of destroyed tissue within two days after the damage induction. (A) Schematic representation of the cryoinjury procedure. The cryotome blade (left side) was precooled in liquid nitrogen, and gently placed just above the fin (right side) for 15s at the position demarcated by the blue line. The arrows indicate spreading of the cold from the blade in the adjacent tissue. (B,C) Time-lapse images of the caudal fin after amputation (B) and cryoinjury (C) showing the appendage before injury, and at 0.5h, 12h, 24h and 48h after the procedure; hpa, hours post-amputation; hpci, hours post-cryoinjury. As opposed to the transection model (B), in which a part of the fin is immediately removed from the amputation plane (red dashed line), the non-surgical exposure to the cold (C) along the cryoinjury plane (blue line) results in a progressive tissue detachment that is apparent between 12 and 48hpci. At 48hpa (B), the initiation of regeneration is detected by the presence of a whitish tissue containing the blastema and wound epidermis. At 48hpci (C), the distal part of the stump contains a partially damaged tissue zone (orange bracket and frame) with affected pigmentation, blood clots and broken bones. The intact zone is restricted to the base of the fin (yellow bracket). Black arrows at 12 and 24hpci indicate the plane with fading pigmentation. (C′) Magnified image of the white dashed line-framed area shown in above panel at 24hpci. (C′′) Magnification of the orange line-framed area shown in above panel at 48hpci. White arrows indicate blood clots. (D) Schematic representation of the tissue damage after cryoinjury at 48hpci, normalized to the distance between the base of the fin and the central cleft. The black-white patterned area corresponds to the sloughed part of the original fin. The remaining fin comprises partially damaged tissue (orange) and an intact stump (yellow). N=6. Scale bar in B=1mm; C′′=100µm.