
- Title
-
Spinal motor neurons are regenerated after mechanical lesion and genetic ablation in larval zebrafish
- Authors
- Ohnmacht, J., Yang, Y.J., Maurer, G.W., Barreiro-Iglesias, A., Tsarouchas, T.M., Wehner, D., Sieger, D., Becker, C.G., Becker, T.
- Source
- Full text @ Development
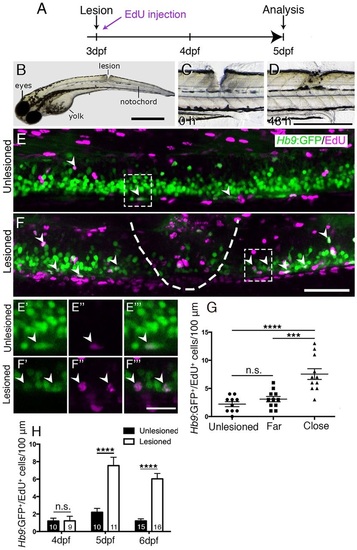
A mechanical lesion to the spinal cord heals within 48h and leads to motor neuron regeneration close to the lesion site. (A) Time line for experiments. (B) A zebrafish larva with a lesion in the dorsal trunk area, leaving the notochord intact at 3dpf. (C,D) The same larva imaged at 0 and 48h post lesion shows closure of the wound. (E,F) The lesion area is outlined with double-labelled Hb9:GFP+/EdU+ neurons indicated by arrowheads. A lesion leads to increased numbers of Hb9:GFP+/EdU+ double-labelled motor neurons (compare E and F). E′ to F′′′ show higher magnifications of areas boxed in E and F, respectively, in single optical sections indicating double labelling. (G) Motor neurons are regenerated close to (<50µm rostral and caudal), but not far from (100µm>×>50µm rostral and caudal) the lesion site (one-way ANOVA with Bonferroni′s multiple comparisons test, ***P<0.001, ****P<0.0001; unlesioned, n=10; far, n=11; close, n=11). (H) Time line of the increase in the number of EdU-labelled motor neurons (t-test, ****P<0.0001). Values are means ± s.e.m. Lateral views of larvae are shown (rostral is left; dorsal is up). Scale bars: 100µm in B; 500µm in D for C,D; 50µm in F for E,F; 15µm in F′′′ for E′-F′′′. |
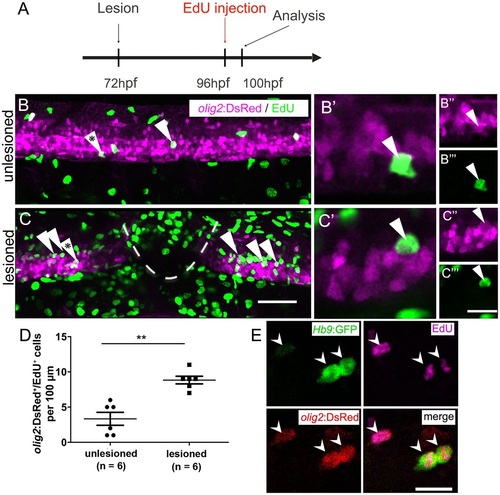
After a lesion, the pMN domain shows increased proliferation and gives rise to motor neurons. (A) Time line of the experiment. (B,C) olig2:DsRed+ cells (arrowheads) in the pMN domain that incorporated EdU within the last 4h. (B′-C′′′) Higher magnifications of single optical sections of the cells indicated by asterisks in B and C, respectively, showing double labelling. (D) The number of proliferating cells in the pMN domain is significantly increased in the vicinity of the lesion site (Mann-Whitney test; **P=0.0049). (E) In Hb9:GFP and olig2:DsRed double-transgenic larvae (lesion: 3dpf; analysis: 5dpf), newly generated motor neurons (Hb9:GFP+/EdU+) that retain DsRed protein are indicated by arrowheads. Lateral views are shown; rostral is left, dorsal is up. Values are means±s.e.m. Scale bars: 50µm in C for B,C; 20µm in C′′′ for B′′-C′′′ and 10µm for B′,C&prime& 15µm in E. |
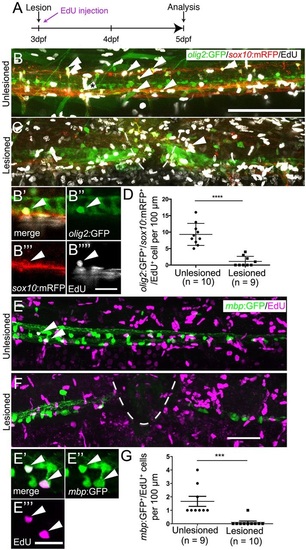
Oligodendrocyte generation is reduced after a spinal lesion. (A) Time line of the experiment. (B,C) Newly generated oligodendrocytes and their precursors, triple labelled by olig2:GFP, sox10:mRFP and EdU (arrowheads), are reduced in number after lesion. (B′-B′′′′) A triple-labelled cell (indicated with asterisk in B) in a single optical section at higher magnification. (D) The number of triple-labelled cells is reduced (Student′s t-test, ****P<0.0001). (E) mbp:GFP+ oligodendrocytes incorporate EdU (indicated by arrowheads) in unlesioned larvae. (E′-E4) Two double-labelled neurons indicated in E at higher magnification in a single optical section. (F) Fewer double-labelled cells are observed after a lesion. (G) The number of new oligodendrocytes is significantly reduced after a lesion (Mann-Whitney U-test; ***P=0.0005). Lateral views are shown; rostral is left, dorsal is up. The lesion site is indicated by a dashed line. Values are means ± s.e.m. Scale bars: 100µm in B for B,C; 20µm in B′′′′ for B′-B′′′&prime& 50µm in F for E,F; 20µm in E4. |
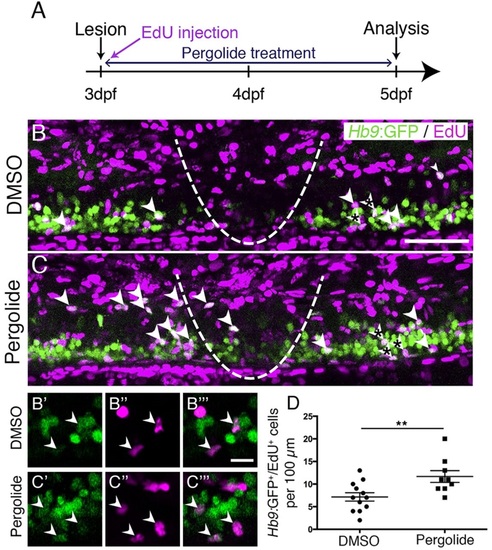
Motor neuron regeneration is enhanced by application of a dopamine agonist. (A) Experimental time line. (B,C) Double-labelled Hb9:GFP+/EdU+ neurons are indicated by arrowheads. (B′-C′′′) Double-labelled cells from B,C (asterisks) are indicated by arrowheads in single optical sections at higher magnification. (D) Pergolide treatment during the regeneration phase significantly increases the number of Hb9:GFP+/EdU+ double-labelled motor neurons (t-test, **P=0.0092; DMSO, n=12; Pergolide, n=9). Lateral views are shown; rostral is left, dorsal is up. The lesion site is indicated by a dashed line. Values are means ± s.e.m. Scale bars: 50µm in B for B,C; 10µm in B′′′ for B′-C′′′. |
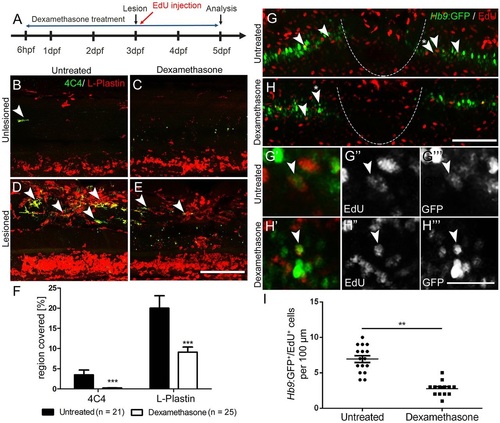
Suppression of the immune response inhibits motor neuron regeneration. (A) Time line for the experiments. (B-F) Incubation with dexamethasone does not lead to visible changes in unlesioned larvae (B,C), but strongly reduces the immune reaction at the lesion site (D,E) as indicated by reduced 4C4 (arrowheads indicate 4C4+ cells) and L-plastin immunoreactivity. Quantification of immunoreactivity is shown in F (Student′s t-test, ***P<0.001). (G-I) Dexamethasone treatment reduces the number EdU-labelled Hb9:GFP+ motor neurons (arrowheads). Higher magnifications of double-labelled neurons indicated by asterisks in G,H are shown in single optical sections in G′-H′′′. (I) Quantification of the reduction in newly generated motor neurons (t-test; **P=0.0085; unlesioned, n=16; dexamethasone, n=13). Lateral views are shown; rostral is left, dorsal is up. The lesion site is indicated by a dashed line. Values are means±s.e.m. Scale bars: 100µm in E for B-E; 100µm in H for G,H; 50µm in H′′′ for G′-H′′′. |
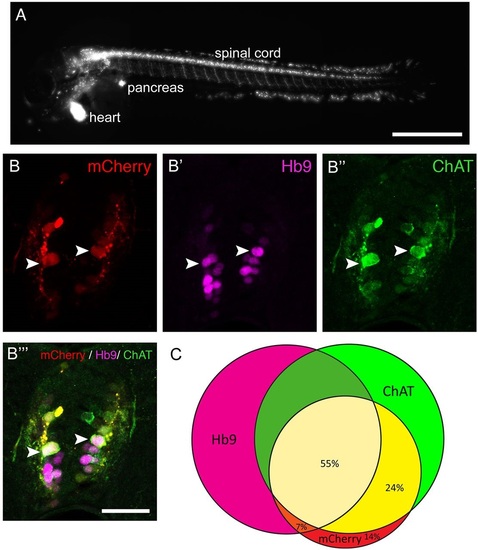
The Tg(mnx1:Gal4, UAS:nfsB-mCherry) transgene is expressed in motor neurons. (A) Lateral view of a whole larva (rostral left, dorsal up, 3dpf) indicates labelling in spinal motor neurons, the pancreas and heart. (B,C) Spinal cross sections (3dpf) indicate that most mCherry+ cells are also Hb9+ or ChAT+, or both. Arrowheads indicate triple-labelled cells. (C) Venn diagram showing the overlap of mCherry expression with motor neuron markers. Scale bars: 500µm in A; 25µm in B′′′ for B-B′′′. |
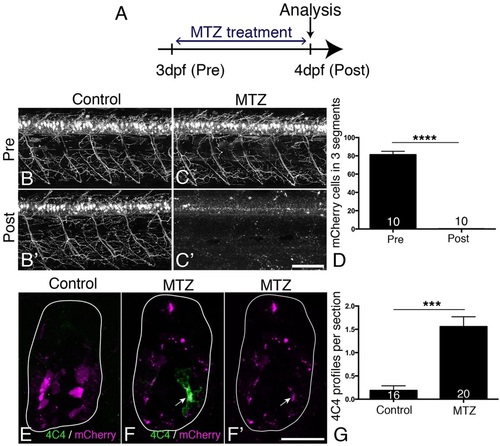
MTZ treatment leads to ablation of all transgene-expressing cells and to microglia/macrophage activation. (A) Treatment time line. (B-D) mCherry+ motor neurons and their axons are visible in untreated control larvae at 3 and 4dpf (B,B′), but mCherry labelling is completely lost after 24h treatment with MTZ (C,C′), quantified in D (Mann–Whitney U-test, ****P<0.0001). (E-G) Cross sections show that mCherry-labelled cells fragment during MTZ treatment and that microglia/macrophages appear and phagocytose the cell debris (arrow in F,F′). Microglia/macrophages are quantified in G (Mann-Whitney U-test, ***P<0.0001). Values are means±s.e.m. Scale bars: 100µm in C′ for B-C′; 25µm in F′ for E-F′. |
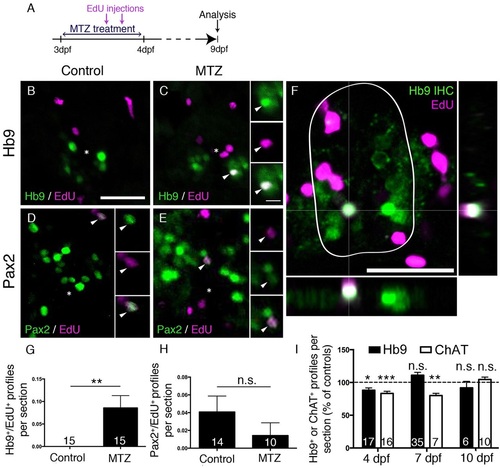
Motor neuron ablation leads to regeneration of motor neurons. (A) Experimental timeline. (B-H) In spinal cross sections, Hb9+/EdU+ motor neurons are only observed in MTZ-treated larvae (B,C, shown in a whole cross section of the spinal cord including orthogonal views in F), whereas Pax2+ interneurons are labelled by EdU in untreated and MTZ-treated larvae, quantified in G (Mann–Whitney U-test, **P=0.0063) and H (Mann–Whitney U-test, P>0.99), respectively. (I) Overall numbers of Hb9+ and ChAT+ profiles are reduced after a lesion, but return to control values at 7dpf (Hb9 only) or 10dpf (ChAT) (t-test, *P=0.0188; **P=0.0012; ***P=0.0004). Values are means±s.e.m. Scale bars: 25µm in B for B-E; 5µm in inset in C for all insets; 25µm in F. |
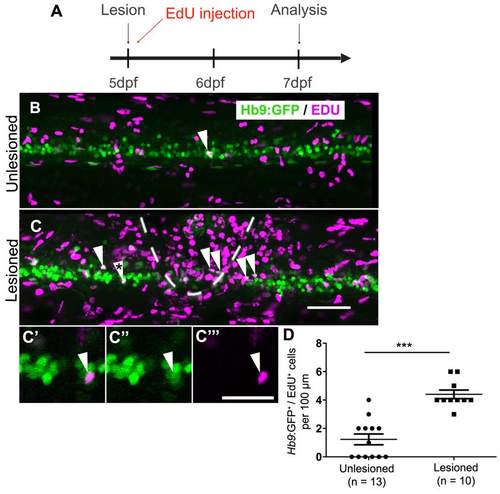
In older larvae, a lesion also leads to motor neuron regeneration within 48 hours. (Lateral views are shown; rostral is left, dorsal is up. The lesion site is indicated by dashed line) A: The timeline of the experiment is shown. B,C: The density of EdU labeled Hb9:GFP+ motor neurons (arrowheads) is strongly increased in the vicinity of a lesion site (dashed line in B). C′-C′′: The double-labeled cell marked by an asterisk in C is shown at higher magnification in a single optical section. D: Quantification shows a significant increase in motor neuron generation between 5 and 7 dpf (t-test, ***P < 0.0001). Scale bar C = 50 µm for B,C; in C′′′ = 20 µm for C′-C′′′. |
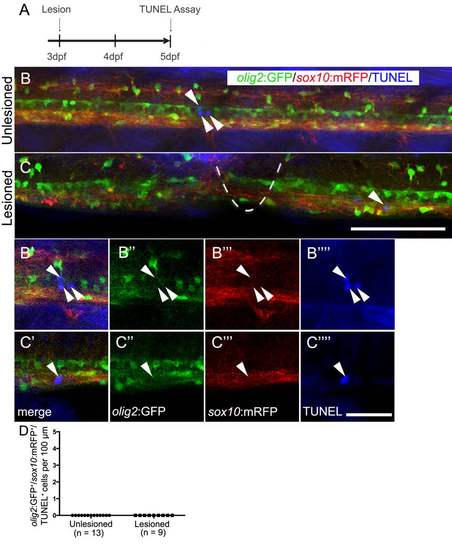
Oligodendrocyte-lineage cells do not show increased cell death after a lesion. Lateral views of the trunk area are shown; rostral is left, dorsal is up. A: The timeline of the experiment is shown. B,C: In the unlesioned and lesioned spinal cord, TUNEL+ cells (arrows) are rare (lesion site indicated by dashed line in C). B′-C′′′′: Analysis of single optical sections at higher magnification reveals lack of co-labeling of TUNEL+ cells with olig2:GFP and sox10:mRFP. D: olig2:GFP+/sox10:mRFP+/TUNEL+ cells were not observed in unlesioned and lesioned animals. Bar in C = 100 µm for B,C; in C′′′′ = 20 µm for B′-C′′′′. |
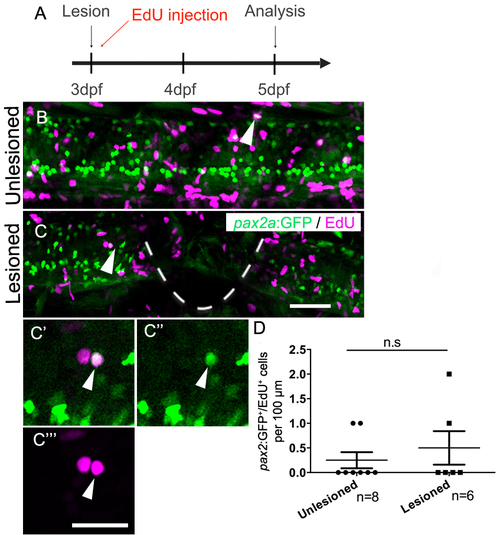
Generation of pax2a:GFP+ interneurons is not affected by a spinal lesion. (Lateral views are shown; rostral is left, dorsal is up. The lesion site is indicated by a dashed line). A: The timeline of the experiment is shown. B,C: EdU+/pax2a:GFP+ cells (arrows) are present in unlesioned (B) and lesioned (C) larvae. C′-C′′′: Higher magnifications of the cell indicated C is shown in a single optical section. D: Quantification shows no difference in pax2a:GFP+ neuron generation between 5 and 7 dpf (Mann-Whitney U test; P = 0.6839). Scale bar in C = 50 µm for B,C and in C′′′ = 20 µm for C′-C′′′. |
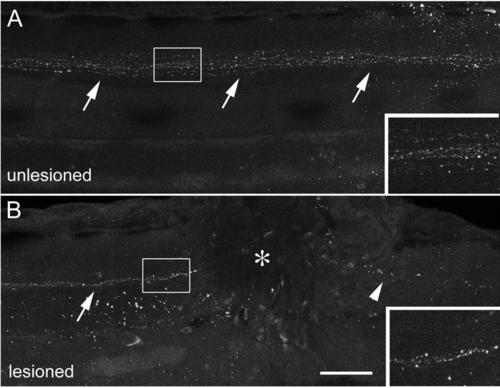
Descending TH1+ axons are present near a spinal lesion site. (Lateral views of the trunk region are shown, rostral is left; dorsal is up.) A: TH1+ axons (arrows) project down the spinal cord in the unlesioned spinal cord at 78 hpf. B: In the lesioned spinal cord, shown at 6 hours after the lesion (lesion at 72 hpf, analysis at 78 hpf), descending axons (arrow) are present rostral to the lesion site (asterisk), but have degenerated caudal to it (arrowhead). Scale bar = 75 µm and 40 µm for insets. |
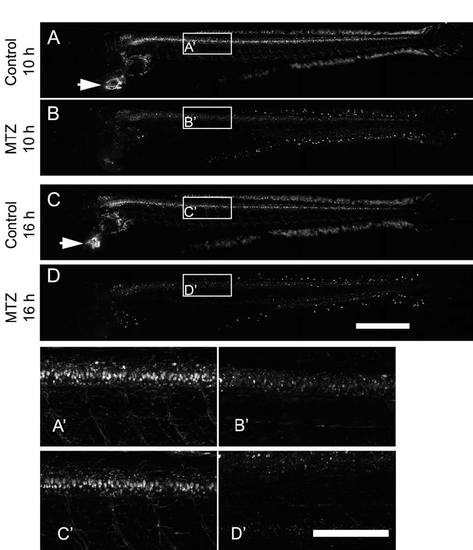
MTZ treatment leads to ablation of spinal motor neurons and heart cells in Tg(mnx1:Gal4, UAS:nfsB-mCherry) transgenic larvae. (Lateral views are shown; rostral is left, dorsal up.) A-D: Fluorescence in motor neurons is strongly diminished at 10 hours into the treatment in motor neurons and has disappeared by 16 hours into the treatment. Fluorescence in the heart (arrows point to the heart in non-treated animals in A,D) is also abolished. A′-D′: Higher magnifications of boxed areas in A-D are shown. Scale bar in D = 500 µm for A-D and 200 µm in D′ for A′-D′. |
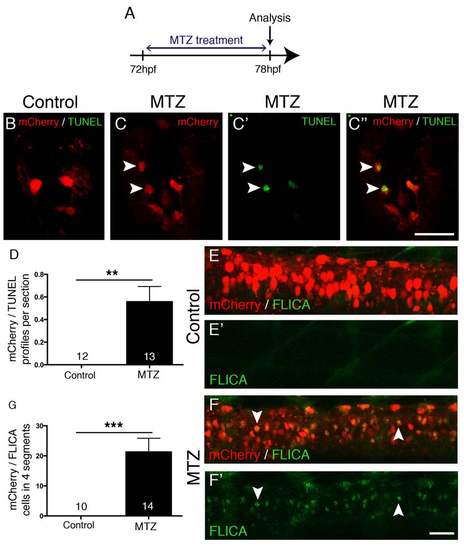
MTZ treatment leads to apoptosis. A: The experimental time line is shown. B-D: Spinal cross sections are shown. During MTZ treatment, mCherry+ cells become TUNEL positive in transgenic, but not in control treated larvae, quantified in D (Mann-Whitney U-test, **p = 0.0039). E-G: Lateral views are shown; dorsal is up, rostral is left. mCherry+ cells become FLICA positive during MTZ treatment (F, F′), but not control treatment (E, E′), quantified in G (Mann-Whitney U-test, ***p = 0.0001). Scale bar in C′′ = 25 µm for B-C′′, in F′ = 50 µm for E-F′. |
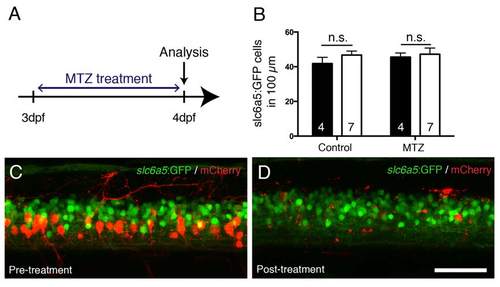
MTZ treatment does not affect slc6a5:GFP+ interneurons in the vicinity of ablated mCherry+ cells. A: The experimental time line is shown. BD: In the same Tg(mnx1:Gal4, UAS:nfsB-mCherry) larva, mCherry+ cells are successfully ablated by MTZ treatment, but slc6a5:GFP+ interneurons are unaffected in number. Lateral trunk views of the same larva, before (C) and after (D) the treatment are shown, quantified in B. Scale bar in D = 50 µm for C,D. |
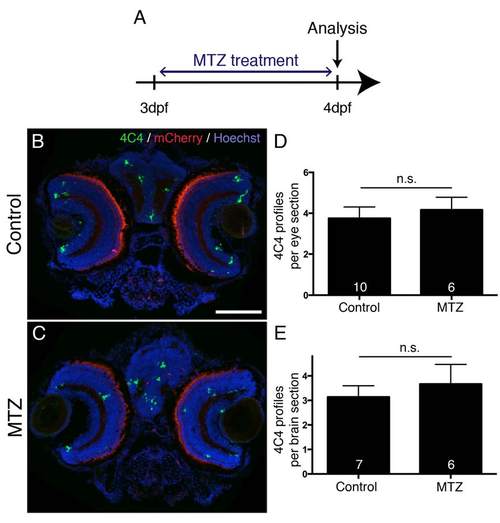
MTZ treatment does not lead to increased microglia/macrophage labeling in brain and eye. A: The experimental time line is shown. B-E: In cross sections (dorsal is up) through the head of MTZ treated Tg(mnx1:Gal4, UAS:nfsB-mCherry) larvae, the number of microglia/macrophage profiles in the eyes (D) and brain (E) are not different from control treated larvae (Mann- Whitney U-test, p > 0.05). Photoreceptors show non-specific fluorescence in the red channel. Scale bar in B = 100 µm for B,C. |