
Image
|
Figure Caption
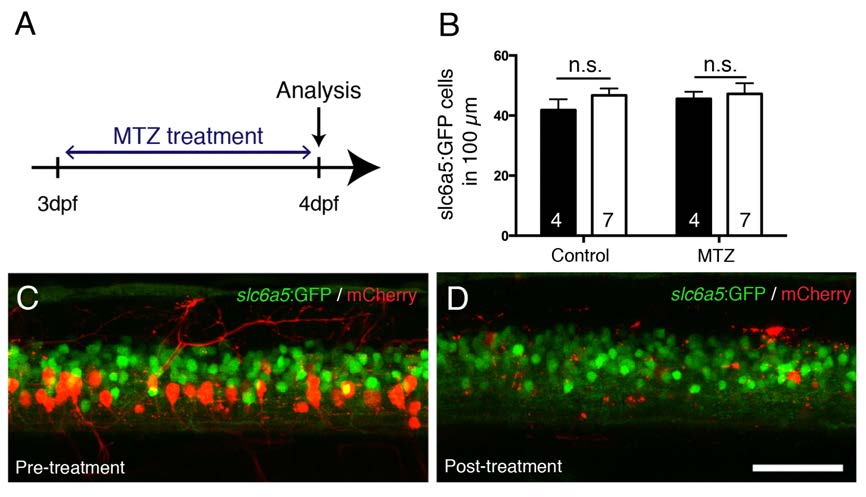
Fig. S8
MTZ treatment does not affect slc6a5:GFP+ interneurons in the vicinity of ablated mCherry+ cells. A: The experimental time line is shown. BD: In the same Tg(mnx1:Gal4, UAS:nfsB-mCherry) larva, mCherry+ cells are successfully ablated by MTZ treatment, but slc6a5:GFP+ interneurons are unaffected in number. Lateral trunk views of the same larva, before (C) and after (D) the treatment are shown, quantified in B. Scale bar in D = 50 µm for C,D.
Acknowledgments
This image is the copyrighted work of the attributed author or publisher, and
ZFIN has permission only to display this image to its users.
Additional permissions should be obtained from the applicable author or publisher of the image.
Full text @ Development