
|
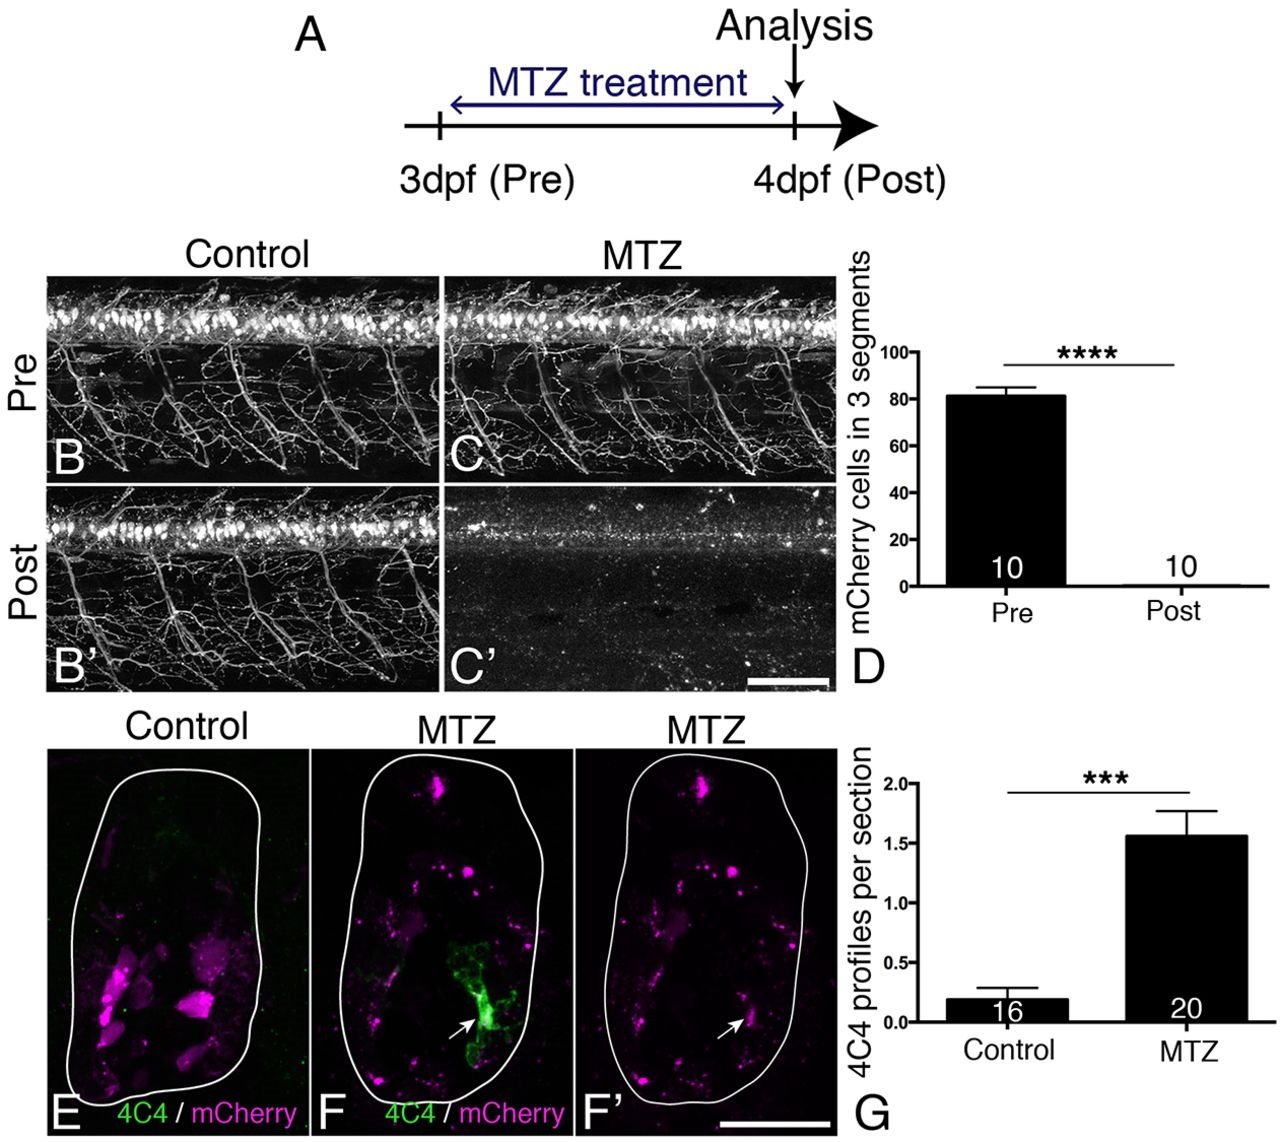
Fig. 7
MTZ treatment leads to ablation of all transgene-expressing cells and to microglia/macrophage activation. (A) Treatment time line. (B-D) mCherry+ motor neurons and their axons are visible in untreated control larvae at 3 and 4dpf (B,B′), but mCherry labelling is completely lost after 24h treatment with MTZ (C,C′), quantified in D (Mann–Whitney U-test, ****P<0.0001). (E-G) Cross sections show that mCherry-labelled cells fragment during MTZ treatment and that microglia/macrophages appear and phagocytose the cell debris (arrow in F,F′). Microglia/macrophages are quantified in G (Mann-Whitney U-test, ***P<0.0001). Values are means±s.e.m. Scale bars: 100µm in C′ for B-C′; 25µm in F′ for E-F′.