
|
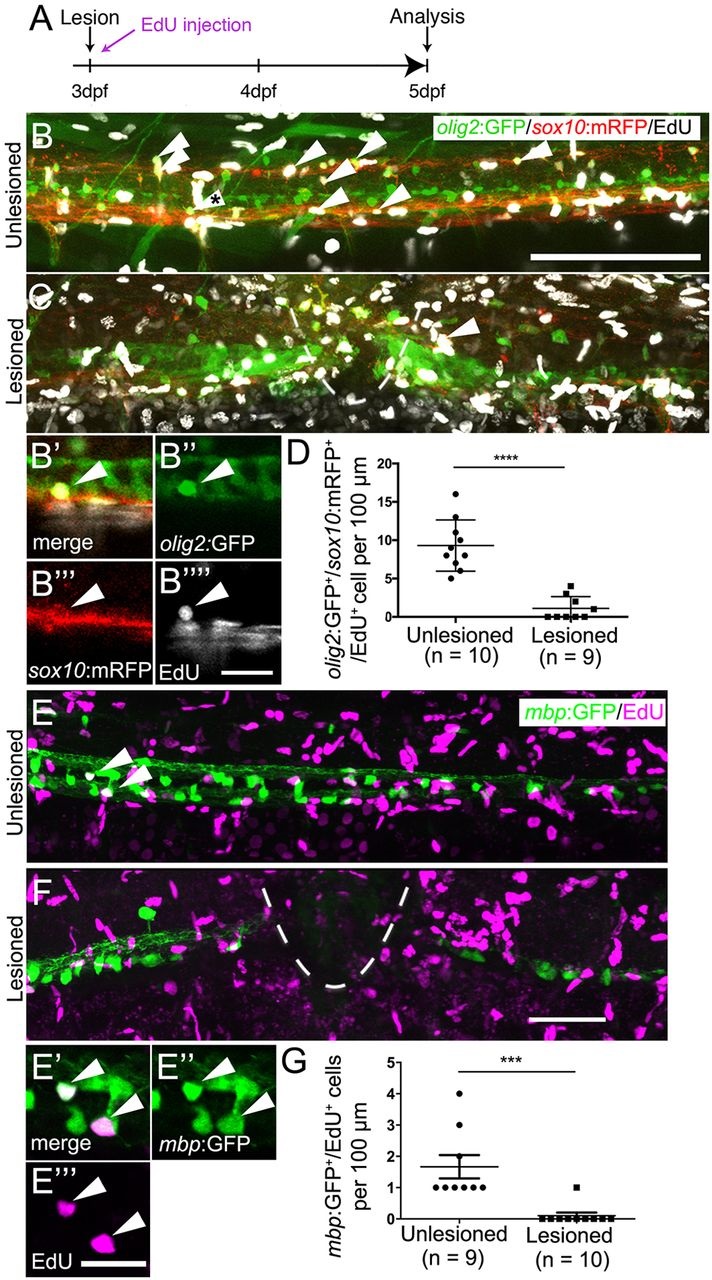
Fig. 3
Oligodendrocyte generation is reduced after a spinal lesion. (A) Time line of the experiment. (B,C) Newly generated oligodendrocytes and their precursors, triple labelled by olig2:GFP, sox10:mRFP and EdU (arrowheads), are reduced in number after lesion. (B′-B′′′′) A triple-labelled cell (indicated with asterisk in B) in a single optical section at higher magnification. (D) The number of triple-labelled cells is reduced (Student′s t-test, ****P<0.0001). (E) mbp:GFP+ oligodendrocytes incorporate EdU (indicated by arrowheads) in unlesioned larvae. (E′-E4) Two double-labelled neurons indicated in E at higher magnification in a single optical section. (F) Fewer double-labelled cells are observed after a lesion. (G) The number of new oligodendrocytes is significantly reduced after a lesion (Mann-Whitney U-test; ***P=0.0005). Lateral views are shown; rostral is left, dorsal is up. The lesion site is indicated by a dashed line. Values are means ± s.e.m. Scale bars: 100µm in B for B,C; 20µm in B′′′′ for B′-B′′′&prime& 50µm in F for E,F; 20µm in E4.