
- Title
-
Cortical Contractility Triggers a Stochastic Switch to Fast Amoeboid Cell Motility
- Authors
- Ruprecht, V., Wieser, S., Callan-Jones, A., Smutny, M., Morita, H., Sako, K., Barone, V., Ritsch-Marte, M., Sixt, M., Voituriez, R., Heisenberg, C.P.
- Source
- Full text @ Cell

Zebrafish Germ Layer Progenitor Cells Exhibit Distinct Cell Migration Modes In Vitro (A) Bright-field (BF) and fluorescence images of blebbing progenitor cells cultured in serum-free medium in confinement with GPI-RFP (membrane, red) and Lifeact-GFP (cortex, green). Red arrow marks cellular bleb. Scale bar represents 20 µm. (A′) BF time-lapse images of non-motile progenitor cells related to culture conditions in (A). Blue asterisk indicates cell center. Scale bar represents 20 µm. (B) TIRFM images of Lifeact-GFP in mesendodermal progenitors cultured on 2D substrates. Arrows mark filopodia (yellow) and lamellipodia (white). Scale bar represents 10 µm. (B′) BF time-lapse images related to culture conditions in (B). Orange asterisks indicate exemplary migrating cells. Scale bar represents 20 µm. (B′′) Representative tracks of motile mesendodermal cells over 20 min (time lag 30 s, n = 15 cells). (C) BF and fluorescence images of polarized progenitor cells with GPI-RFP (red) and Lifeact-GFP (green) cultured in 20% serum in confinement. Yellow arrow points at the bleb-like protrusion front. Scale bar represents 20 µm. (C′) BF time-lapse images of motile stable-bleb cells cultured as described in (C). Red asterisk indicates cell movement. Scale bar represents 20 µm. (D and D′) Sketch and BF images summarizing different migration phenotypes of embryonic progenitor cells in vitro. All progenitor cells were obtained from embryos at sphere stage and cultured on Fibronectin-coated substrates. Scale bar represents 20 µm. See also Movie S1 and Extended Experimental Procedures. |

LPA Induces Cell Polarization to Stable-Bleb Cells In Vitro (A) Percentage of polarized stable-bleb cells over time upon stimulation with 100 µM LPA. (B) Percentage of polarized stable-bleb cells from blastula stage embryos (brown, n = 287) or 75% epiboly stage Tg(mezzo:eGFP) transgenic embryos with mesendodermal (green, n = 183) and ectodermal progenitors (blue, n = 152) after 10 min in the presence of 100 µM LPA (+LPA) or DMEM-F12 culture medium alone (Control [Ctrl] at blastula stage [n = 321], mesendodermal [n = 286], and ectodermal [n = 251]). (C) Percentage of polarized stable-bleb cells cultured in DMEM-F12 medium (Ctrl, n = 272), 100 µM LPA (+LPA, n = 219) or 30 µM LPA supplemented with 10 µM Blebbistatin (+) (n = 167), 10 µM Blebbistatin () (n = 143), 10 µM Y-27632 (n = 149), 100 nM Latrunculin A (LatA, n = 134), and 500 nM Jasplakinolide (Jasplak) (n = 83). (D) Recruitment of myosin II to the cortex of progenitor cells over time after application of 10 µM LPA by a micropipette. Data (black, mean ± SEM) and sigmoid fit function (red) with half time t1/2 = 20 s (n = 30). (E) Myosin II localization in progenitor cells cultured in DMEM-F12 medium alone (Ctrl), 1 µM or 10 µM LPA. Arrows mark blebs (yellow) and the cortex-depleted protrusion front of stable-bleb cells (red). (F) Boxplot of relative cortical myosin II fluorescence intensities for increasing LPA levels in unpolarized progenitor cells (each n = 120). (G) Cortical enrichment of Myl12.1-eGFP (n = 60), Lifeact-GFP (n = 60), and GPI-RFP (n = 33) in non-polarized progenitor cells treated with 10 µM LPA. Cortical fluorescence intensity values ILPA are normalized to reference values without LPA stimulation ICtrl. (H) Relative bleb sizes for increasing LPA levels (each n = 120). (I and J) Relative bleb sizes (I) and relative cortical myosin II fluorescence intensities (J) under non-confined and confined conditions. (K) Exemplary fluorescence images of non-polarized and polarized cells expressing Myl12.1 in non-confined and confined conditions. (L) BF images of mesodermal progenitors cultured in non-confined and confined environments (top) and quantification of cellular protrusions (bottom). (M) Time-lapse BF and fluorescence images of Myl12.1-eGFP localization in mesodermal progenitor cells cultured on a 2D substrate coated with Fibronectin upon LPA stimulation. n.s., not significant, p < 0.001. Boxplots show single cell data points (black) and median (red). All cells were obtained from embryos at sphere stage, despite (B), and cultured in suspension on a passivated substrate despite (L and M). n, number of cells. All scale bars represent 20 µm. See also Figure S1, Movies S2 and S3, and Extended Experimental Procedures. |

Cortical Contractility Fluctuations Drive Polarization to Stable-Bleb Cells (A) Sketch of polarization from a non-polarized state (left) to a polarized stable-bleb state (right). The cell cortex is shown in green and highly contractile cortex areas in red. Red arrows denote a cortical force imbalance due to local fluctuations in cortical contractility. Blebs induce spatial inhomogeneities in cortical contractility of increasing strength for larger bleb sizes. Green arrows indicate cortical flows. (B) Stability diagram illustrating the switch from a non-polarized to a polarized state. The curve represents the values of cortical contractility ζ, depending on the density fluctuation mode number l. The mode number, l, is inversely proportional to the wavelength (in units of initial cell radius) of the fluctuation. (C) Myosin II localization in a transforming progenitor cell cultured in suspension with 30 µM LPA. Scale bar represents 20 µm. (D) Sketch of the local LPA application experiment. (E) BF time-lapse images and Myl12.1-eGFP localization during progenitor cell polarization in a local 100 µM LPA diffusion gradient set by a micropipette (red arrow). (F) Histogram of measured cell polarization orientations (n = 32). (G and H) Schematic illustration of the positive feedback loop between cortical actomyosin density gradients and rearward cortical flows for the maintenance of stable-bleb cell polarity. Local fluctuations in cortical contractility induce a flow toward the contractile region along with mass transport of actin and myosin (red dots) that reinforces the initial instability (G). To maintain a continuous cortical flow in polarized cells actin turnover (with rate constants kp and kd) and diffusion of free actin and myosin (with diffusion constant D) is required (H). Polarization is lost upon pharmacological inhibition of myosin II contractility (by Blebbistatin), actin polymerization (by Latrunculin-A) and actin de-polymerization (by Jasplakinolide). See also Figure S2, Movies S2 and S4, and Extended Experimental Procedures. |
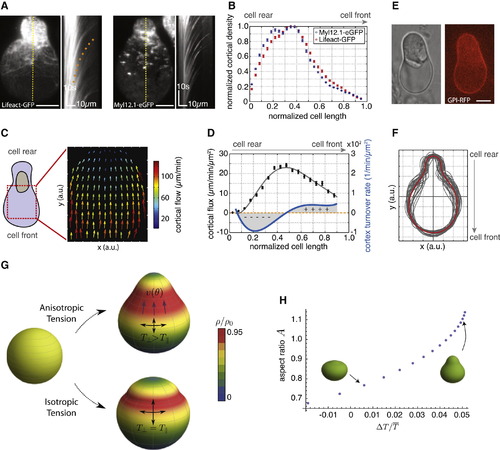
Cortical Architecture Determines Cell Shape of Stable-Bleb Cells In Vitro (A) TIRFM image showing Lifeact-GFP (left) and myosin II localization (right) in isolated stable-bleb cells with corresponding kymograph data along yellow lines. Orange dotted line indicates the cortical flow profile. (B) Average actin and myosin II density profiles obtained from culture conditions in (A) (n = 30). (C) Average 2D cortical flow map in the spherical protrusion front of stable-bleb cells (n = 3). The red dashed square highlights the analyzed cell area. (D) Cortical flux data (black, mean ± SEM) calculated from average cortical density (B) and average cortical flow profiles (Figure S3C) with polynomial fit (gray) and cortex turnover rate (blue) calculated as the derivative of the cortical flux (n = 30). (E) BF and fluorescence cross-sectional image of an isolated stable-bleb cell expressing GPI-RFP. (F) Average (red) and single cell shapes (gray) of polarized stable-bleb cells (n = 30). (G) Theoretical predictions on polarized cell shapes generated by cortical tension components parallel TII and perpendicular T⊥ to the polarization axis. Top: anisotropic tension (TII < T⊥). Bottom: isotropic tension (TII = T⊥). Color bar represents normalized cortical density distributions. Magenta arrows indicate the direction of cortical flow v(θ) in polar direction. Parameter values are provided in the Extended Experimental Procedures. (H) Phase diagram of cell shapes with cell aspect ratio A as a function of tension anisotropy. Elongated, pear shapes are obtained for higher anisotropy. All cells were cultured on a PEG-coated substrate either with (A–D) or without confinement (E and F). Scale bars represent 10 µm. See also >Figure S3 and Extended Experimental Procedures. |

Migration Characteristics of Stable-Bleb Cells In Vitro (A) Illustration of progenitor cells cultured under serum/LPA-free (I, II) or serum/LPA-containing (III, IV) conditions with (II, IV) or without (I, III) confinement. (A′) Table summarizing cell migration characteristics for different culture conditions. (B–D) N-Cadherin-GFP (B), Ezrin-YFP (C), and Integrinα5-Integrinβ1-BiFc-Venus (D) localization in polarized stable-bleb cells. (E) Representative tracks of migrating stable-bleb cells. (F) Mean-square displacement (MSD) analysis data (blue, n = 67) with fit to a persistent random walk model (gray) and compared to random (~t, orange) and directed migration (~t2, red). Black dashed line highlights random migration on timescales above the persistence time Pt ~10 min (persistence length H150 µm). (F′) Sketch of MSD time point analysis. Arrows denote variations in the direction of movement affecting persistence of cell movement. (G) Average instantaneous stable-bleb cell migration speeds in confinement between glass-agarose or glass-glass assays for varying substrate coatings as indicated. (H–J) Localization of Paxillin-GFP for stable-bleb cells on BSA- (H), PEG- (I), and Fibronectin-coated (J) glass substrates in confinement. (K) Paxillin-GFP localization for mesodermal progenitors cultured on 2D planar substrates coated with Fibronectin. n denotes number of cells. White dashed lines in (H)–(K) outline cell contact areas. All scale bars represent 10 µm. See also Extended Experimental Procedures. |
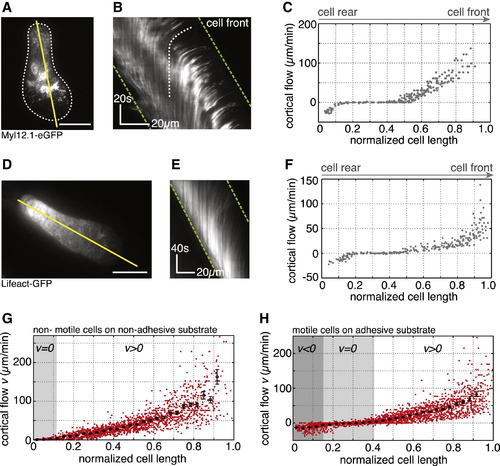
Frictional Coupling of Retrograde Cortical Flows Drives Stable-Bleb Migration (A and D) TIRFM images of (A) Myl12.1-eGFP and (D) Lifeact-GFP localization in motile stable-bleb cells. White dashed line marks the cell-to-substrate contact area. Scale bars represent 10 µm. (B and E) Kymograph data along the direction of movement indicated by yellow lines in (A) and (D). Green dashed lines outline cell front and rear advancement. White dashed line highlights the rearward flow of a representative fluorescent patch. (C and F) Retrograde cortical flow velocity data in single stable-bleb cells obtained from kymograph data in (B) and (E) with vCell = 24.1 µm/min (C) and vCell = 18.2 µm/min (F). (G and H) Average (black) and single cell local flow velocity data (red) of migrating stable-bleb cells (H) (n = 15) with average cell speed vCell = 19.2 ± 2.4 µm/min and of non-motile stable-bleb cells (G) (n = 30) cultured in confinement under agarose on a non-adhesive PEG-coated substrate (vCell = 0). Shaded areas denote regions with zero (v = 0, light gray) or anterograde (v < 0, dark gray) cortical flow. Cortical flows are shown in the laboratory frame of reference. All cells were cultured in the presence of 30 µM LPA in confinement under agarose on Fibronectin-coated substrates despite data in (G). n, number of cells. Error bars represent mean ± SEM. See also Figure S4, Movie S5, and Extended Experimental Procedures. |
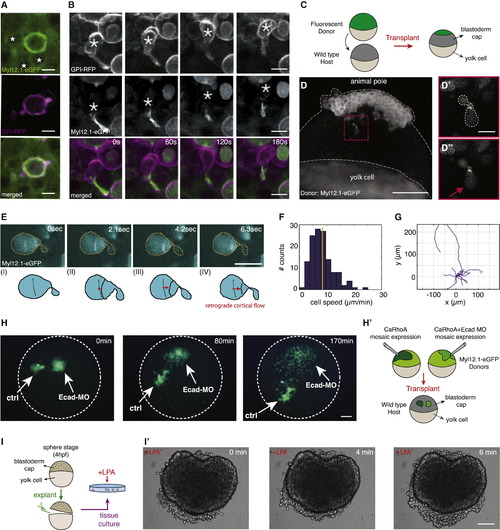
Identification and Characterization of Stable-Bleb Cells In Vivo (A) Myl12.1-eGFP (green) and GPI-RFP (magenta) localization in non-polarized embryonic cells observed in a Tg(actβ1:myl12.1eGFP) transgenic embryo at sphere stage expressing caRhoA and GPI-RFP in a mosaic pattern. Asterisks denote cell nuclei in the vicinity of a caRhoA expressing cell highlighting cells with reduced cortical accumulation of myosin II compared to caRhoA expressing cells. Scale bars, 10 µm. (B) Fluorescence time-lapse series of a stable-bleb like cell in a Tg(actβ1:myl12.1eGFP) transgenic embryo at sphere stage expressing caRhoA and GPI-RFP in a mosaic pattern. Scale bars represent 10 µm. (C) Illustration of the transplantation experiment in (D). (D) Transplantation of cells from a Tg(actβ1:myl12.1eGFP) transgenic donor to a wild-type host embryo at sphere stage. A stable-bleb-like cell emerging from the transplanted tissue is highlighted in the red box. Scale bar represents 100 µm. (D′ and D′′) Magnified views on transplanted stable-bleb-like cells observed in (D). Dashed white line marks cell borders. Red arrow indicates the spherical protrusion front. Scale bar represents 20 µm. (E) Myl12.1-eGFP localization and cortical flow in a stable-bleb cell obtained from transplantation of Tg(actβ1:myl12.1eGFP) transgenic donor cells into a wild-type host. Red arrows point to the direction of cortical flow. Dashed yellow lines outline cell borders. Scale bar represents 25 µm. (F and G) Representative tracks (F) and instantaneous migration speeds (G) of stable-bleb cells in vivo (n = 15 cells) with average velocity (<vcell> = 8.5 ± 0.3 µm/min; yellow line). (H) Time-lapse fluorescence images of a cell transplantation between Myl12.1-eGFP donor embryos expressing caRhoA (Ctrl) or caRhoA+E-Cadherin morpholino (Ecad-MO) and a wild-type host at dome stage. Dashed white lines outline the embryo margin. 3Scale bar represents 100 µm. (H′) Schematic illustration of the transplantation experiment in (H). (I) Sketch of tissue explant preparation and culturing. (I′) BF time-lapse images of a blastoderm tissue explant obtained from wild-type embryos at sphere stage and cultured with 30 µM LPA. Scale bar represents 100 µm. See also Figure S5, Movies S6, S7, and S8, and Extended Experimental Procedures. |

LPA Stimulates Stable-Bleb Cell Transformation In Vitro, Related to Figure 2 (A) Percentage of polarized stable-bleb cells cultured in suspension in the presence of 100 µM LPA for 10 min (n = 219) or different serum growth factors hEGF (n = 143), mFGF-8b+rhFGF-3 (n = 121), and PDGF-AA (n = 162) at a concentration of 100 ng/µl for 30 min. (B) Percentage of polarized stable-bleb cells cultured in suspension at varying levels of LPA for 10 min. (C) Bright-field and fluorescence time-lapse images of Myl12.1-eGFP (myosin II) localization during reversible polarization of progenitor cells obtained from Tg(actβ1:myl12.1eGFP) transgenic embryos. Red arrow denotes local application of 100 µM LPA by a micropipette. Blue arrow marks removal of micropipette. Yellow arrows indicate polarized stable-bleb cells. (D) Lifeact-GFP localization in progenitor cells obtained from Tg(actβ1:lifeact-GFP) embryos and cultured in DMEM-F12 medium alone (Ctrl, top) and in the presence of 10 µM LPA (bottom). Yellow arrows mark blebs. (E) Bright-field time-lapse images of a polarized progenitor cell cultured in suspension in the presence of 30 µM LPA. Red arrow marks application of 500 nM Jasplakinolide to the culture medium. All cells were obtained from embryos at sphere stage (4 hpf). All scale bars, 10 µm. |

Cortical Contractility Fluctuations Drive Stable-Bleb Cell Transformation, Related to Figure 3 (A) Illustration of contractility-driven cortical instability in a non-polarized cell. In an element of cortex (shown as zoom in), a gradient in actin filament density (filaments are represented by red sticks) results in a net contractile force to the right; this results in a net flow, which amplifies the accumulation of actin on the right. The instability is opposed by actin turnover (given by polymerization and depolymerization rates, kp and kd), osmotic effects (i.e., steric repulsion between filaments), friction (with coefficient ξ), and actin viscosity. During cortical instability and in the polarized state of the cell, the cortical tension is inhomogeneous, and the tension component parallel to the polarization axis (T∥) is generally different from the perpendicular component (T⊥). (B) Myl12.1-eGFP (myosin II) localization in progenitor cells cultured in DMEM-F12 medium alone (ctrl, top) and in the presence of 1 µM LPA (middle) or 10 µM LPA (bottom). Corresponding fluorescence intensity profiles were measured across the cell body (red lines) and bleb protrusions (blue lines), indicating a differential contractility between cell cortex and bleb cortex that increases for higher LPA concentrations. (C) Relative bleb sizes given as the ratio of bleb contour length LBleb to cell contour length LCell obtained from fluorescence cross-sectional images of progenitor cells as shown in (B) at varying amounts of LPA (n = 60 for all conditions). (D) Growth rate of cortical instability versus density fluctuation mode number l (<1/wavelength). The growth rate, λl in units R4/ρ02γ, is shown for three values of cortical contractility, given by the parameter ζ=R2/ρ0γ (ζ-βρ30) : ζ=1, ζ=3, ζ=5. Other parameter values are η/ξR2Χ=0, and (R4ξ/ρ02γ)kd=1. The curves indicate that, due to the competing effects of contractility and density gradient energy penalties, there is, in general, only a particular window of fluctuation wavelengths that are unstable. (E) Bright-field (top) and fluorescence time-lapse images of Myl12.1-eGFP (myosin II) localization during progenitor cell polarization in a local 100 µM LPA diffusion gradient set by a micropipette (red arrow). (F) Table of pharmacological inhibitors summarizing their molecular targets and effects on stable-bleb cell polarization. Myl12.1-eGFP expressing cells in (B) and (E) were obtained from Tg(actβ1:myl12.1eGFP) transgenic embryos at sphere stage (4 hpf). Number of cells is given by n. All scale bars, 10 µm. |
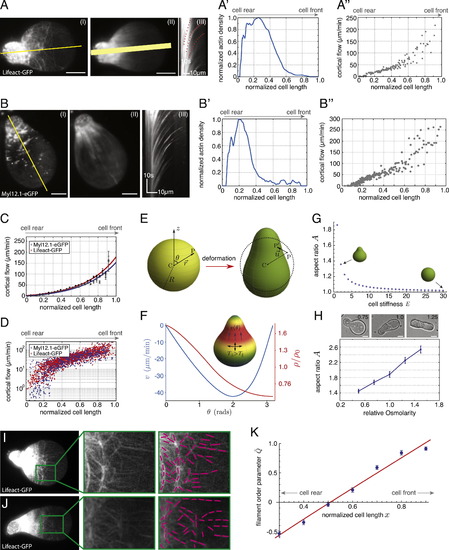
Actomyosin Cortical Flows and Spatial Cortical Density Gradients Determine the Shape of Polarized Stable-Bleb Cells, Related to Figure 4 (A) TIRFM image (I) of a polarized stable-bleb cell obtained from Tg(actβ1:lifeact-GFP) transgenic embryos at sphere stage (4 hpf) and cultured in confinement under agarose on a PEG-coated substrate in the presence of 30 µM LPA. (II) Averaged fluorescence image over 50 frames and (III) kymograph data along yellow line in (I). (A′) Single cell density profile along yellow line in (II). Width of yellow line in (II) indicates the lateral line extent used for calculating average density profiles. (A′′) Single cell cortical flow profile obtained from kymograph data in (III). (B) TIRFM image (I) of a polarized stable-bleb cell obtained from Tg(actβ1:myl12.1eGFP) transgenic embryos at sphere stage (4 hpf) and cultured in confinement under agarose on a PEG-coated substrate in the presence of 30 µM LPA. (II) Average fluorescence image over 50 frames and (III) kymograph along the axis of polarization. (B′ and B′′) Single cell density (B′) and cortical flow profile (B′′) obtained along yellow line in (II) and kymograph data (III). (C) Average cortical flow profile of data for Myl12.1eGFP (gray, mean ± sem; n = 27) with exponential fit (blue) and Lifeact-GFP (black, mean ± sem; n = 30) with exponential fit (red). (D) Log-Linear plot of single cell cortical flow data obtained from (C). (E) Illustration of cell shape change resulting from cortical tension. The un-deformed state of the cell is assumed to be spherical with radius R. An arbitrary point P in the cytoplasm gets shifted to P2 under deformation, by an amount u (vector). (F) Cortical flow and density profile in the polarized state of the cell. In the steady state, inhomogeneous solutions to v(Θ) and ρ(Θ) determine the cortical tensions and friction that are exerted on the bulk of the cell, and, as a result, the cell shape in the polarized state (shown in inset). The parameter values for the determination of v(Θ) and ρ (Θ), and the cell deformation are: ζ β2/ξR2Χ=2, η/ξR2=0.1, (R4ξ/ρ20γ)kd=1, β=1, and (R4ξ/ρ20γ)Χ=1. The cortical flow is indicated in µm/min (taking kd = 0.1 s1 (Pollard and Borisy, 2003) and R = 20 µm), while the actin density is expressed relative to the unperturbed value, ρ0 (which, without loss of generality, we take to be equal to one). (G) Phase diagram of cell shapes showing cell aspect ratio A versus cell stiffness E. (H) Representative bright-field images of polarized progenitor cells cultured at varying osmotic conditions in the presence of 30 µM LPA with numbers indicating relative medium osmolarities (standard medium 1.0, hypoosmotic 0.75, hyperosmotic 1.25; top) and quantification of cell aspect ratios for varying medium osmolarities (n = 50 cells for all conditions). (I and J) TIRF images of Lifeact-GFP localization in polarized progenitor cells obtained from Tg(actβ1:lifeact-GFP) embryos cultured in non-adhesive confinement under agarose in the presence of 30 µM LPA (left). Magnification of green highlighted area (middle) and tracking of filament alignment (right). (K) Quantification of filament alignment order parameter Q along the normalized cell length x with theoretical fit function (see Equations S29, S30, and S31). All scale bars, 10 µm. |
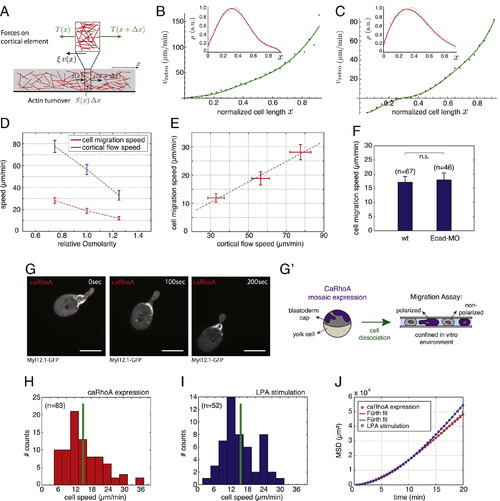
Cortical Flows Drive Stable-Bleb Cell Migration via Frictional Coupling to the Environment, Related to Figure 6 (A) Schematic illustration of a one-dimensional cortex layer with an actin filament gradient (red sticks) flowing with speed v(x). The forces per unit length acting on a cortex element of length dx are the tensions T(x), T(x + dx), and the frictional force ξv(x)dx. (B) Retrograde flow speed versus distance along flow direction for non-motile cells on PEG (slipping conditions). Symbols indicate the experimental data for average cortical flow speed vretro obtained from Figure 6G; inset shows cortical density data with fit (red) to a fifth-order polynomial in x. From the fit to vretro (green) we obtain the friction coefficient ξPEG C 108 Pa·s/m. (C) Retrograde flow speed versus distance along flow direction for motile cells. Symbols indicate the experimental data for vretro obtained from Figure 6H; inset shows cortical density data and fit (red) to a fifth-order polynomial in x. From the fit to vretro (green) we obtain the friction coefficient ξrunning = 2.8 × 10⁸ Pa·s/m. (D) Average cell migration speed (red) and average cortical flow speed (blue) measured at x = 0.7 normalized cell length (x = 0, cell rear; x = 1, cell front) for varying relative medium osmolarities (standard medium 1.0, hypoosmotic 0.75, hyperosmotic 1.25). (E) Correlation plot of cell migration speed versus cortical flow velocity from data obtained in (D). (F) Mean instantaneous cell migration speed of polarized stable-bleb cells obtained from wild-type embryos (wt) or wild-type embryos injected with E-Cadherin morpholinos (Ecad-MO) cultured in confinement in the presence of 30 µM LPA. (G) Fluorescence time-lapse images of Myl12.1-eGFP (myosin II) localization in a polarized progenitor cell expressing a constitutively active version of rhoA (caRhoA) obtained from wild-type embryos with mosaic expression of caRhoA. (G′) Schematic illustration of experimental configuration in (G). Polarized and non-polarized progenitor cells are obtained by dissociation of caRhoA mosaic embryos and cultured in confinement on non-coated glass substrates in the absence of serum or growth factors such as LPA. (H) Mean instantaneous cell migration speed of polarized caRhoA expressing stable-bleb cells cultured as described in (G′). (I) Mean instantaneous cell migration speed of polarized stable-bleb cells obtained from wild-type embryos and cultured in conditions similar to (H) but in the presence of 30 µM LPA. (J) Mean square displacement (MSD) analysis of cell trajectories obtained from data in (H) and (I). All cells were obtained from embryos at sphere stage (4 hpf). All scale bars, 20 µm. |
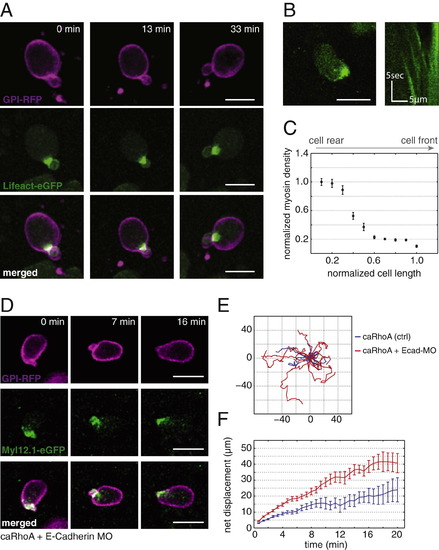
Characterization of Motile caRhoA-Expressing Cells In Vivo, Related to Figure 7 (A) Fluorescence time-lapse images of a single polarized stable-bleb cell transplanted from a transgenic Tg(actβ1:lifeact-GFP) donor with mosaic expression of caRhoA plus GPI-RFP into a wild-type host. (B) Localization of Myl12.1-eGFP (myosin II) in a single polarized progenitor cell transplanted from a transgenic Tg(actβ1:myl12.1eGFP) donor with mosaic expression of caRhoA plus GPI-RFP into a wild-type host (left) with kymograph data along cell margin (right). (C) Quantification of Myl12.1-eGFP (myosin II) localization in polarized stable-bleb cells along normalized cell length in vivo (n = 4 cells). (D) Fluorescence time-lapse images of a single polarized stable-bleb cell transplanted from a transgenic Tg(actβ1:myl12.1eGFP) donor with mosaic expression of a constitutively active version of rhoA (caRhoA) plus GPI-RFP plus e-Cadherin morpholinos (MO) into a wild-type host. (E) Exemplary 2D projected in vivo tracks of polarized motile cells expressing either caRhoA (blue) or caRhoA plus e-Cadherin MO (caRhoA+Ecad-MO, red) obtained from transplantation experiments as described in (D). (F) Quantification of average single cell net displacement over time for polarized motile cells expressing either caRhoA (blue) or caRhoA plus e-Cadherin MO (caRhoA+Ecad-MO, red). All scale bars, 20 µm. |
Reprinted from Cell, 160, Ruprecht, V., Wieser, S., Callan-Jones, A., Smutny, M., Morita, H., Sako, K., Barone, V., Ritsch-Marte, M., Sixt, M., Voituriez, R., Heisenberg, C.P., Cortical Contractility Triggers a Stochastic Switch to Fast Amoeboid Cell Motility, 673-685, Copyright (2015) with permission from Elsevier. Full text @ Cell