
Fig. S4
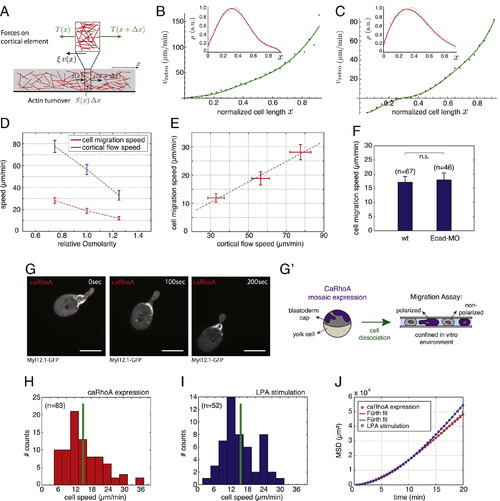
Cortical Flows Drive Stable-Bleb Cell Migration via Frictional Coupling to the Environment, Related to Figure 6 (A) Schematic illustration of a one-dimensional cortex layer with an actin filament gradient (red sticks) flowing with speed v(x). The forces per unit length acting on a cortex element of length dx are the tensions T(x), T(x + dx), and the frictional force ξv(x)dx. (B) Retrograde flow speed versus distance along flow direction for non-motile cells on PEG (slipping conditions). Symbols indicate the experimental data for average cortical flow speed vretro obtained from Figure 6G; inset shows cortical density data with fit (red) to a fifth-order polynomial in x. From the fit to vretro (green) we obtain the friction coefficient ξPEG C 108 Pa·s/m. (C) Retrograde flow speed versus distance along flow direction for motile cells. Symbols indicate the experimental data for vretro obtained from Figure 6H; inset shows cortical density data and fit (red) to a fifth-order polynomial in x. From the fit to vretro (green) we obtain the friction coefficient ξrunning = 2.8 × 10⁸ Pa·s/m. (D) Average cell migration speed (red) and average cortical flow speed (blue) measured at x = 0.7 normalized cell length (x = 0, cell rear; x = 1, cell front) for varying relative medium osmolarities (standard medium 1.0, hypoosmotic 0.75, hyperosmotic 1.25). (E) Correlation plot of cell migration speed versus cortical flow velocity from data obtained in (D). (F) Mean instantaneous cell migration speed of polarized stable-bleb cells obtained from wild-type embryos (wt) or wild-type embryos injected with E-Cadherin morpholinos (Ecad-MO) cultured in confinement in the presence of 30 µM LPA. (G) Fluorescence time-lapse images of Myl12.1-eGFP (myosin II) localization in a polarized progenitor cell expressing a constitutively active version of rhoA (caRhoA) obtained from wild-type embryos with mosaic expression of caRhoA. (G′) Schematic illustration of experimental configuration in (G). Polarized and non-polarized progenitor cells are obtained by dissociation of caRhoA mosaic embryos and cultured in confinement on non-coated glass substrates in the absence of serum or growth factors such as LPA. (H) Mean instantaneous cell migration speed of polarized caRhoA expressing stable-bleb cells cultured as described in (G′). (I) Mean instantaneous cell migration speed of polarized stable-bleb cells obtained from wild-type embryos and cultured in conditions similar to (H) but in the presence of 30 µM LPA. (J) Mean square displacement (MSD) analysis of cell trajectories obtained from data in (H) and (I). All cells were obtained from embryos at sphere stage (4 hpf). All scale bars, 20 µm. |
Reprinted from Cell, 160, Ruprecht, V., Wieser, S., Callan-Jones, A., Smutny, M., Morita, H., Sako, K., Barone, V., Ritsch-Marte, M., Sixt, M., Voituriez, R., Heisenberg, C.P., Cortical Contractility Triggers a Stochastic Switch to Fast Amoeboid Cell Motility, 673-685, Copyright (2015) with permission from Elsevier. Full text @ Cell