
|
Fig. 7
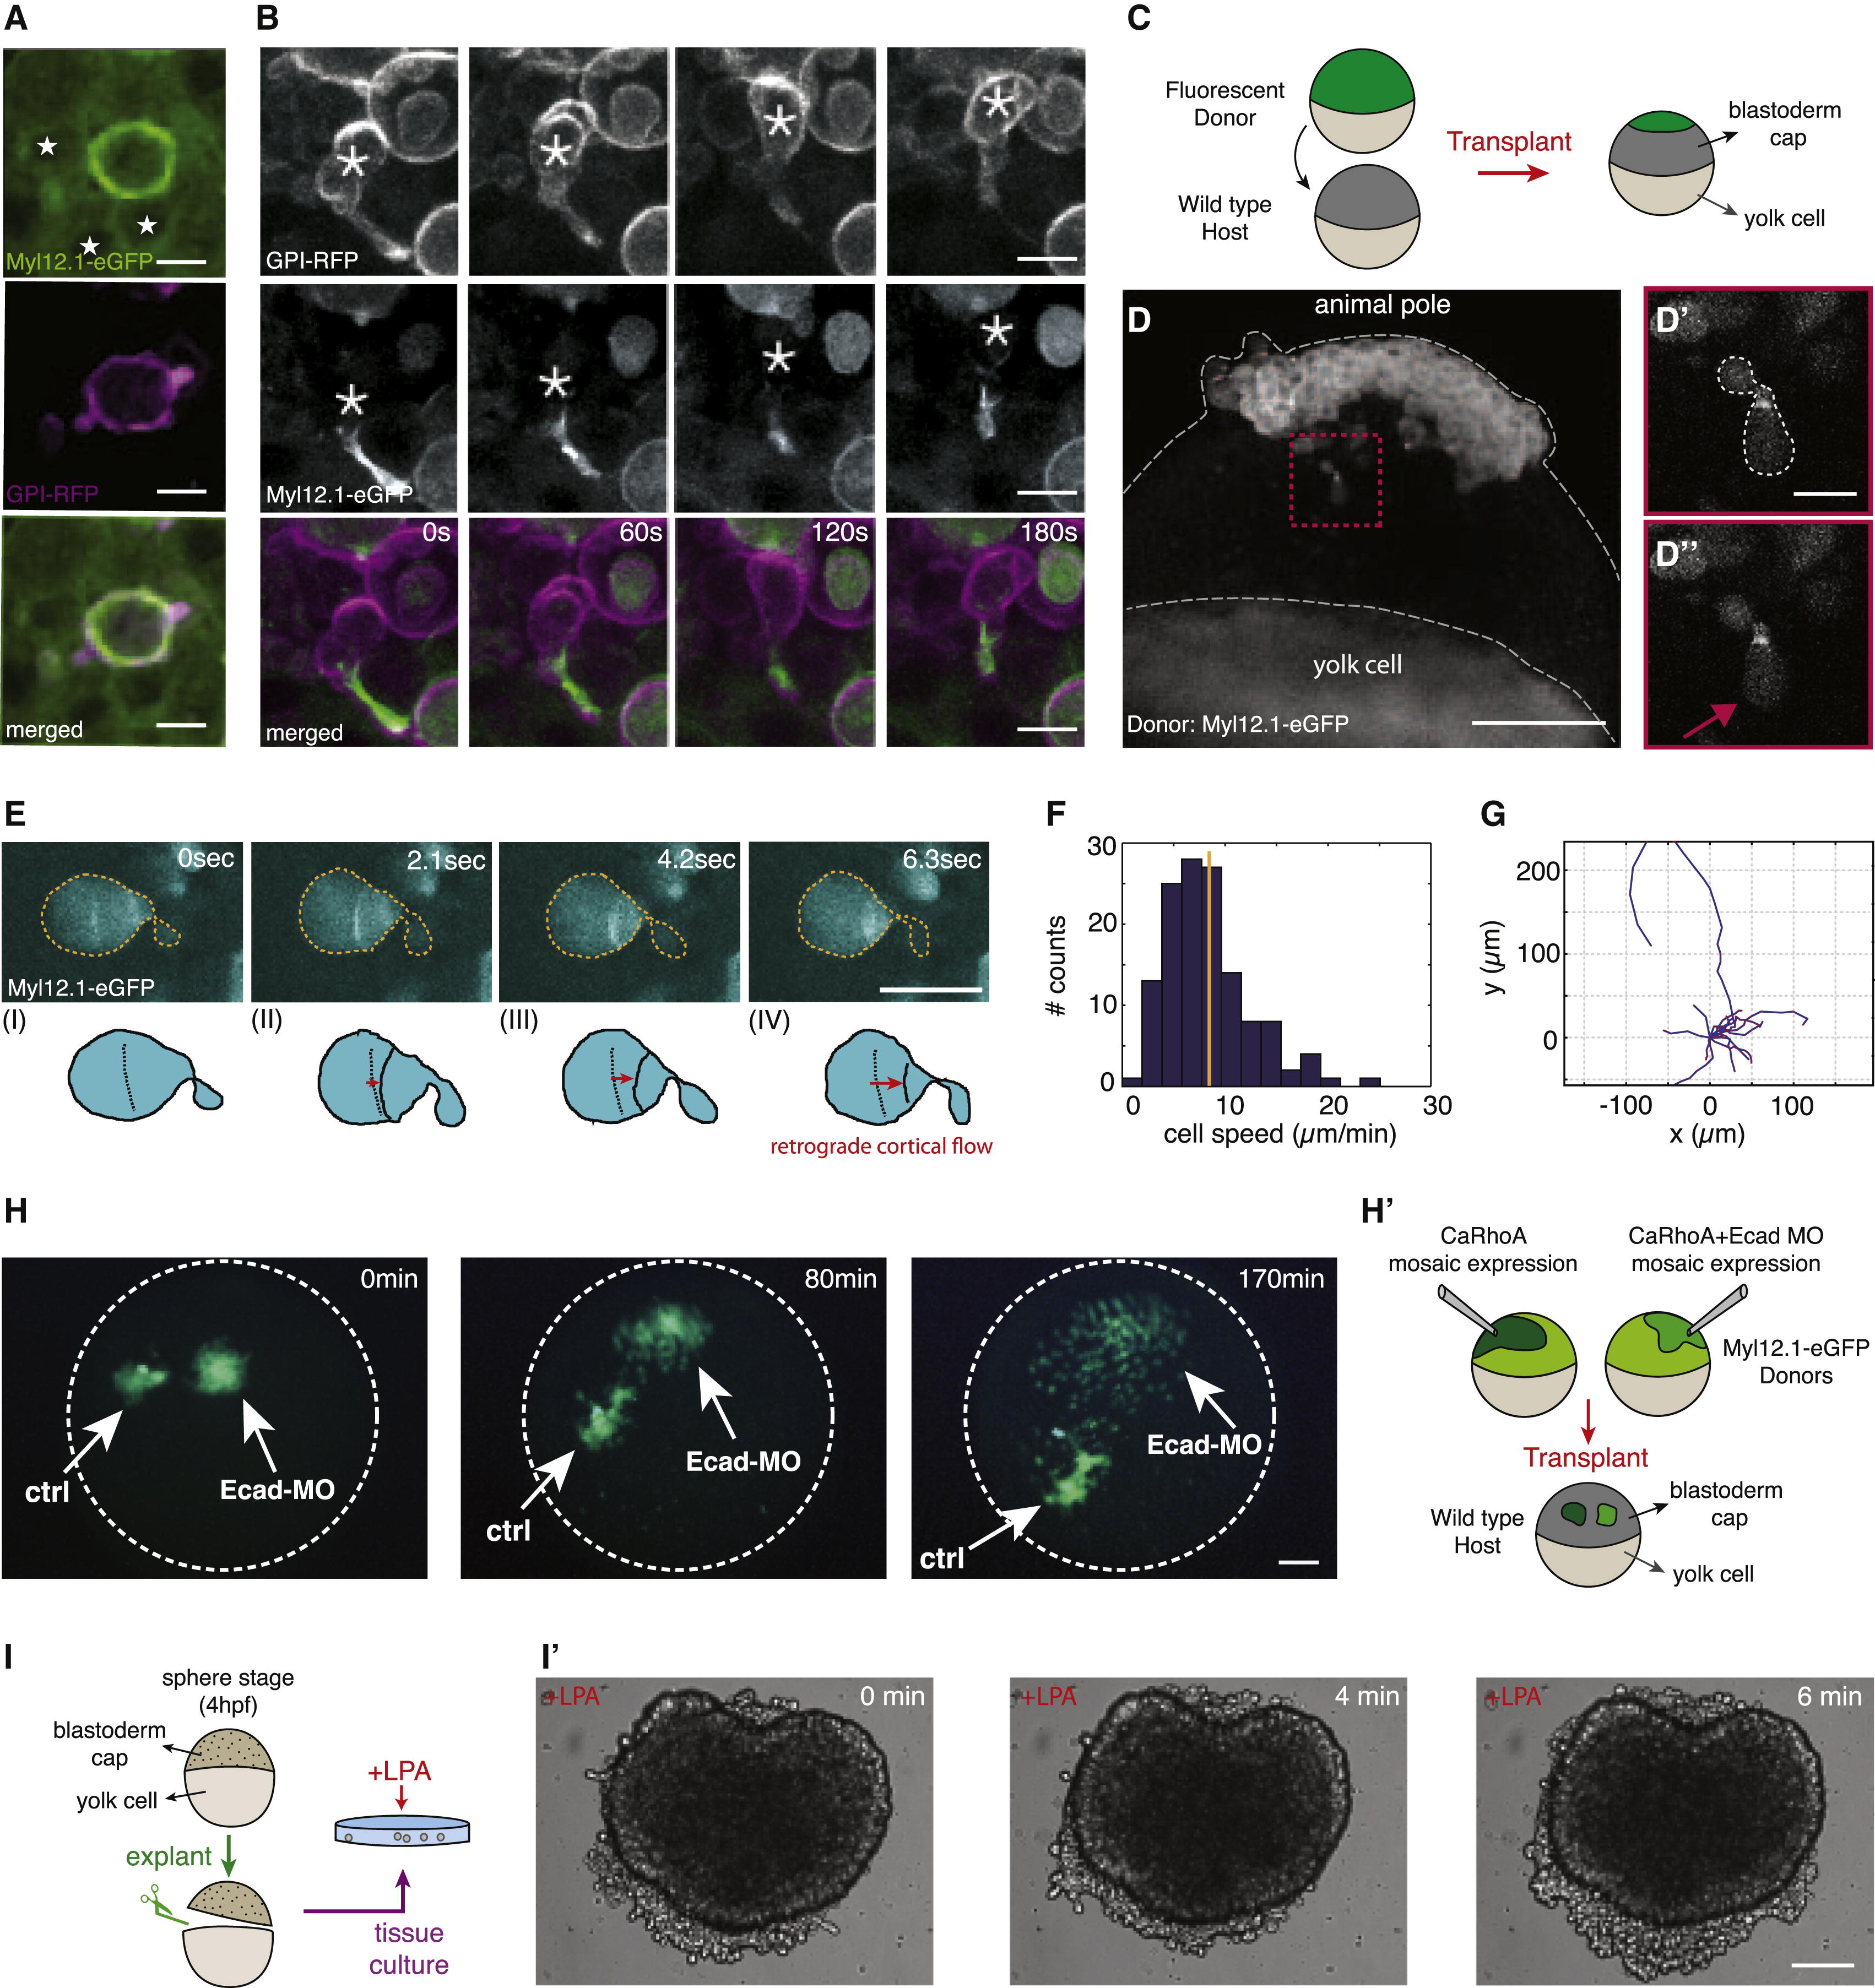
Identification and Characterization of Stable-Bleb Cells In Vivo
(A) Myl12.1-eGFP (green) and GPI-RFP (magenta) localization in non-polarized embryonic cells observed in a Tg(actβ1:myl12.1eGFP) transgenic embryo at sphere stage expressing caRhoA and GPI-RFP in a mosaic pattern. Asterisks denote cell nuclei in the vicinity of a caRhoA expressing cell highlighting cells with reduced cortical accumulation of myosin II compared to caRhoA expressing cells. Scale bars, 10 µm.
(B) Fluorescence time-lapse series of a stable-bleb like cell in a Tg(actβ1:myl12.1eGFP) transgenic embryo at sphere stage expressing caRhoA and GPI-RFP in a mosaic pattern. Scale bars represent 10 µm.
(C) Illustration of the transplantation experiment in (D).
(D) Transplantation of cells from a Tg(actβ1:myl12.1eGFP) transgenic donor to a wild-type host embryo at sphere stage. A stable-bleb-like cell emerging from the transplanted tissue is highlighted in the red box. Scale bar represents 100 µm.
(D′ and D′′) Magnified views on transplanted stable-bleb-like cells observed in (D). Dashed white line marks cell borders. Red arrow indicates the spherical protrusion front. Scale bar represents 20 µm.
(E) Myl12.1-eGFP localization and cortical flow in a stable-bleb cell obtained from transplantation of Tg(actβ1:myl12.1eGFP) transgenic donor cells into a wild-type host. Red arrows point to the direction of cortical flow. Dashed yellow lines outline cell borders. Scale bar represents 25 µm.
(F and G) Representative tracks (F) and instantaneous migration speeds (G) of stable-bleb cells in vivo (n = 15 cells) with average velocity (<vcell> = 8.5 ± 0.3 µm/min; yellow line).
(H) Time-lapse fluorescence images of a cell transplantation between Myl12.1-eGFP donor embryos expressing caRhoA (Ctrl) or caRhoA+E-Cadherin morpholino (Ecad-MO) and a wild-type host at dome stage. Dashed white lines outline the embryo margin. 3Scale bar represents 100 µm.
(H′) Schematic illustration of the transplantation experiment in (H).
(I) Sketch of tissue explant preparation and culturing.
(I′) BF time-lapse images of a blastoderm tissue explant obtained from wild-type embryos at sphere stage and cultured with 30 µM LPA. Scale bar represents 100 µm.
See also Figure S5, Movies S6, S7, and S8, and Extended Experimental Procedures.
Reprinted from Cell, 160, Ruprecht, V., Wieser, S., Callan-Jones, A., Smutny, M., Morita, H., Sako, K., Barone, V., Ritsch-Marte, M., Sixt, M., Voituriez, R., Heisenberg, C.P., Cortical Contractility Triggers a Stochastic Switch to Fast Amoeboid Cell Motility, 673-685, Copyright (2015) with permission from Elsevier. Full text @ Cell