
|
Fig. 4
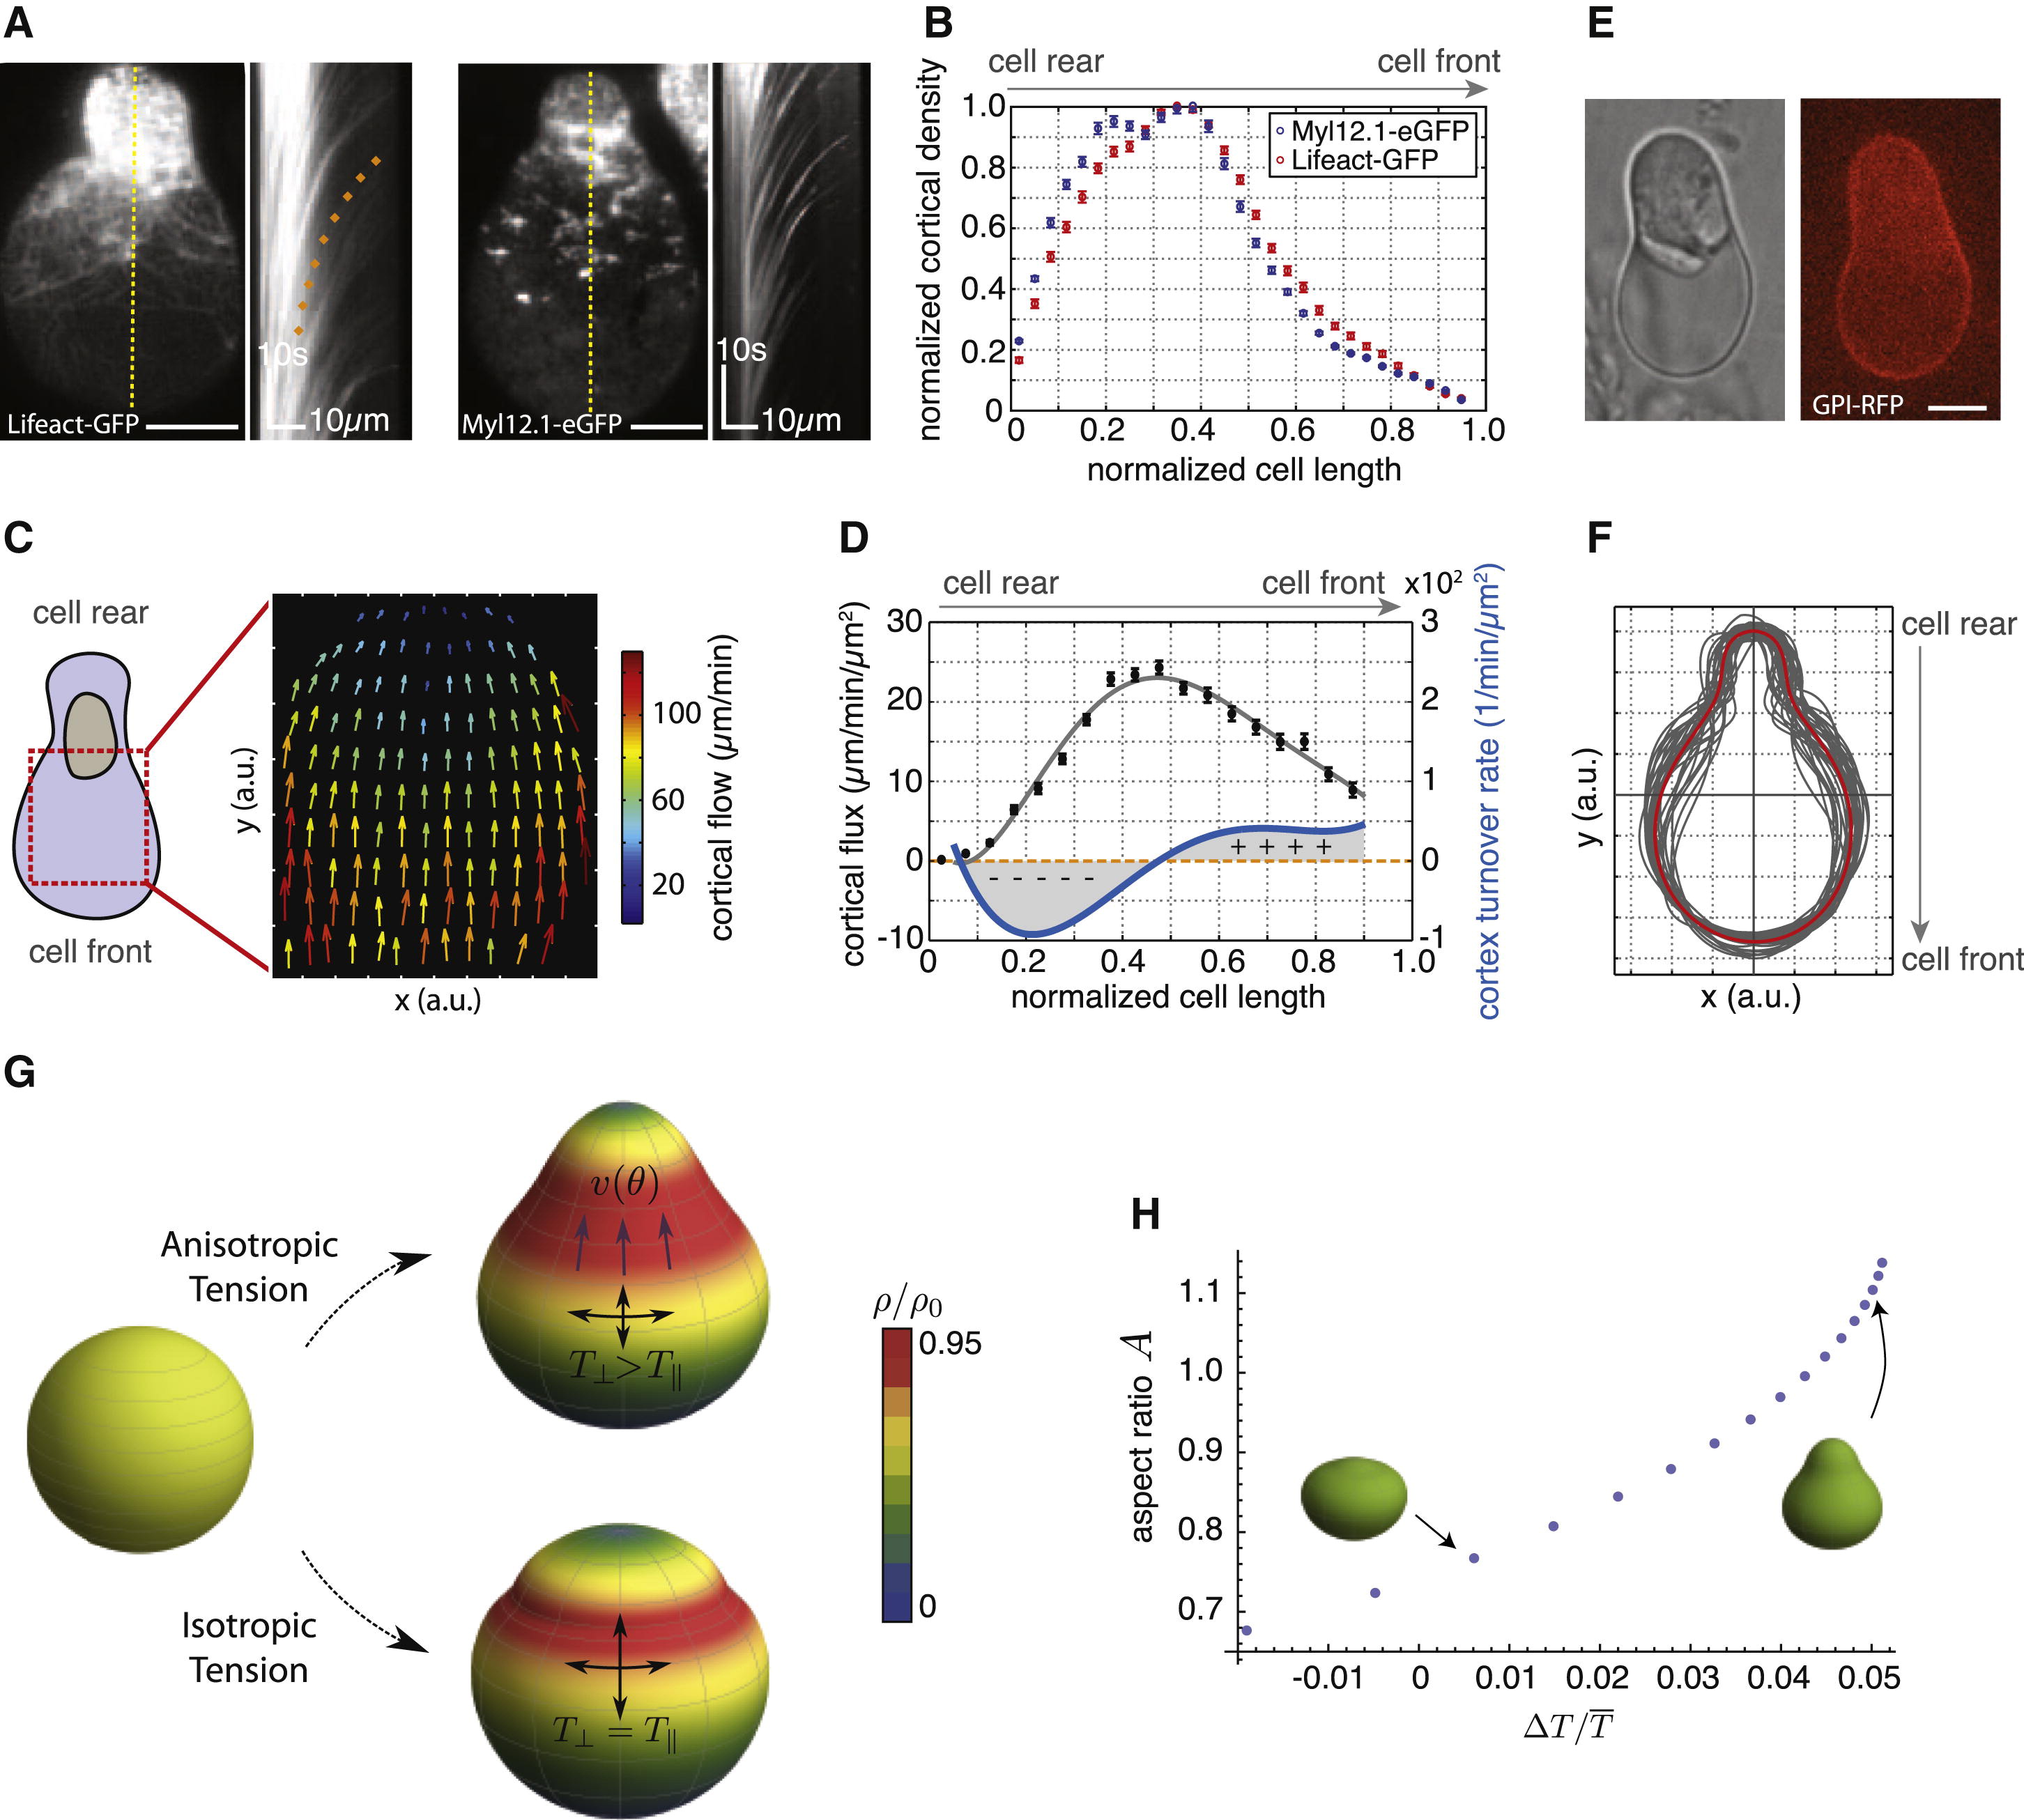
Cortical Architecture Determines Cell Shape of Stable-Bleb Cells In Vitro
(A) TIRFM image showing Lifeact-GFP (left) and myosin II localization (right) in isolated stable-bleb cells with corresponding kymograph data along yellow lines. Orange dotted line indicates the cortical flow profile.
(B) Average actin and myosin II density profiles obtained from culture conditions in (A) (n = 30).
(C) Average 2D cortical flow map in the spherical protrusion front of stable-bleb cells (n = 3). The red dashed square highlights the analyzed cell area.
(D) Cortical flux data (black, mean ± SEM) calculated from average cortical density (B) and average cortical flow profiles (Figure S3C) with polynomial fit (gray) and cortex turnover rate (blue) calculated as the derivative of the cortical flux (n = 30).
(E) BF and fluorescence cross-sectional image of an isolated stable-bleb cell expressing GPI-RFP.
(F) Average (red) and single cell shapes (gray) of polarized stable-bleb cells (n = 30).
(G) Theoretical predictions on polarized cell shapes generated by cortical tension components parallel TII and perpendicular T⊥ to the polarization axis. Top: anisotropic tension (TII < T⊥). Bottom: isotropic tension (TII = T⊥). Color bar represents normalized cortical density distributions. Magenta arrows indicate the direction of cortical flow v(θ) in polar direction. Parameter values are provided in the Extended Experimental Procedures.
(H) Phase diagram of cell shapes with cell aspect ratio A as a function of tension anisotropy. Elongated, pear shapes are obtained for higher anisotropy. All cells were cultured on a PEG-coated substrate either with (A–D) or without confinement (E and F). Scale bars represent 10 µm.
See also >Figure S3 and Extended Experimental Procedures.
Reprinted from Cell, 160, Ruprecht, V., Wieser, S., Callan-Jones, A., Smutny, M., Morita, H., Sako, K., Barone, V., Ritsch-Marte, M., Sixt, M., Voituriez, R., Heisenberg, C.P., Cortical Contractility Triggers a Stochastic Switch to Fast Amoeboid Cell Motility, 673-685, Copyright (2015) with permission from Elsevier. Full text @ Cell