
- Title
-
Zebrafish Adar2 Edits the Q/R Site of AMPA Receptor Subunit gria2alpha Transcript to Ensure Normal Development of Nervous System and Cranial Neural Crest Cells
- Authors
- Li, I.C., Chen, Y.C., Wang, Y.Y., Tzeng, B.W., Ou, C.W., Lau, Y.Y., Wu, K.M., Chan, T.M., Lin, W.H., Hwang, S.P., Chow, W.Y.
- Source
- Full text @ PLoS One
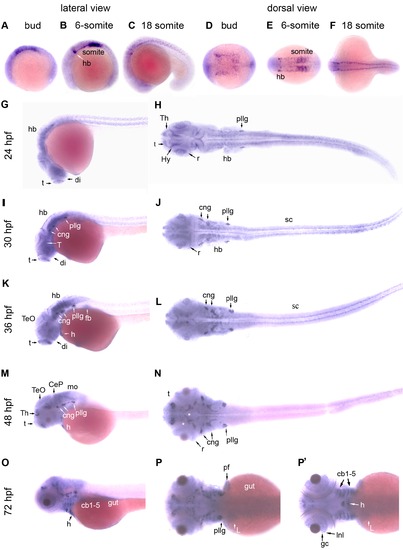
Expression patterns of zebrafish adar2 during embryogenesis. The developmental stages are indicated on top and on the left, as hour post fertilization (hpf). (A, B, C, G, I, K, M and O) Lateral views and (D, E, F, H, J, L, N, P and P′) dorsal views of the embryos. The anterior and dorsal sides are respectively to the left and top. (P and P′) Images were taken from two different focuses. P′ Image is slightly deeper showing the adar2 expression in the ventral structures. Abbreviations: cb1-5, ceratobranchials 1–5; CeP, cerebellar plate; cng, cranial ganglion; di, diencephalon; fb, fin bud; gc, retinal ganglion cells; h, heart; hb, hindbrain; Hy, hypothalamus; Inl, inner nuclear layer; L, liver; mo, medullar oblongata; pf, pectoral fin; pllg, posterior lateral line placode/ganglion; r, retina; sc, spinal cord; t, telencephalon; T, tegmentum; TeO, tectum opticm; Th, thalamus. EXPRESSION / LABELING:
|
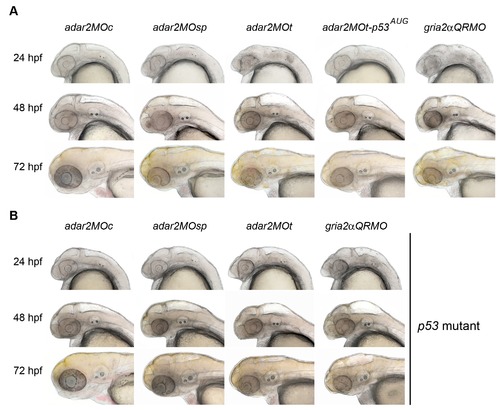
Head morphology of hypo-Q/R-editing morphants. (A) Bright-field images of morphants established in the wild type background between 24 to 72 hpf. The genotypes of the morphants are indicated on the top, where adar2MOc, adar2MOsp, adar2MOt, adar2MOt-p53AUG and gria2αQRMO respectively indicate embryos receiving the mismatch morpholino (MOc), splicing blocker (MOsp), translation blocker (MOt), MOt plus p53-MOAUG [22], and RNA editing blocker (QRMO) morpholinos. Developmental time is shown on the left. The brain ventricles are enlarged and the size of heads is reduced in the hypo-Q/R-editing morphants. (B) Bright-field images of p53 mutant (tp53zdf1) receiving morpholinos described in (A) between 24 to 72 hpf. The morphological changes of adar2MO and gria2αQRMO cannot be suppressed by losing p53 activity. PHENOTYPE:
|
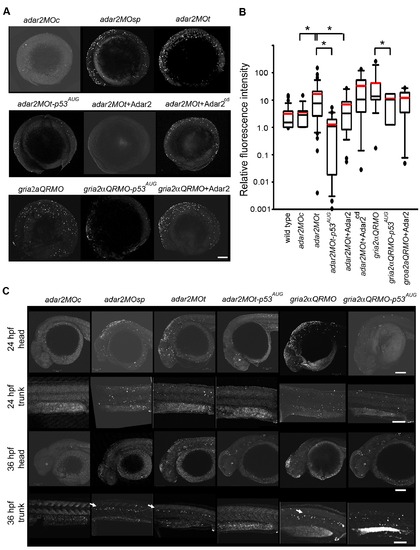
Increased p53-dependent apoptosis in the hypo-Q/R-editing morphants. (A) Apoptosis at the 5-somite stage. Representative images, except those co-injected with p53-MOAUG, were selected from the ones showing the mean fluorescence intensities in the TUNEL (terminal deoxynucleotidyl transferase-mediated dUTP nick end-labeling) analysis. The anterior is to the left, and dorsal side is to the top. Top panel shows the adar2MOc, adar2MOsp and adar2MOt. Middle panel shows adar2MOt co-injected with p53AUG morpholino to block p53 activity, with adar2 cRNA (Adar2) and with adar2cd cRNA (Adar2cd). The bottom panel shows gria2αQRMO, and the gria2αQRMO co-injected with p53AUG and with adar2 cRNA. (B) Tukey box plot of the relative TUNEL signals at 5-somite stage. Boxes represent 50% inter quartile values. Black and red lines respectively mark the median and mean intensities. Outliers are marked as dots. All signals were normalized to a wild-type embryo, showing mean intensity, stained in the same batch (relative fluorescence intensity). The total embryos included in the analysis are 8 adar2MOc (2 batches), 42 adar2MOt (9 batches), 19 adar2MOt-p53 AUG (3 batches), 20 adar2MOt+Adar2 (3 batches), 12 adar2MOt+Adar2cd (3 batches), 9 gria2αQRMO (3 batches), 7 gria2αQRMO-p53AUG (3 batches) and 5 gria2αQRMO+ Adar2 (2 batches). (C) Increased p53-dependent apoptosis in specific regions of the 24- and 36-hpf hypo-Q/R-editing morphants. Lateral views of head and trunk at 24 and 36 hpf. Arrows indicate the apoptotic cells along the horizontal myoseptum. Scale bars represent 100 μm. PHENOTYPE:
|
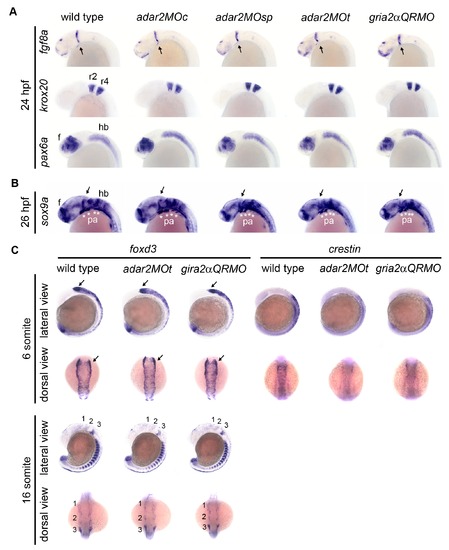
Gene expression in neural tube and migratory neural crest. (A, B) Embryos are under lateral view. (A) Expressions of brain regionalization genes. Expression of fgf8, krox20, and pax6a appear normal in the 24 hpf hypo-Q/R-editing morphants. (B, C) Expressions of neural crest genes. The expression of mesenchymal condensations marker, sox9a, in the pharyngeal arch (pa, *) are slightly but consistently reduced in the hypo-Q/R-editing morphants. Expressions of neural crest markers foxd3 and crestin are mildly affected at 6-somite and 16-somite stages. Anterior is respectively to the left and top at lateral and dorsal views. 1, 2 and 3 are the three migration cranial neural crest streams originated from posterior mesencephalon and hindbrain. Arrows indicate the midbrain hindbrain boundary. e, eye; hb, f, forebrain, hb, hindbrain; r2 and r4, rhombomeres 2 and 4. EXPRESSION / LABELING:
|
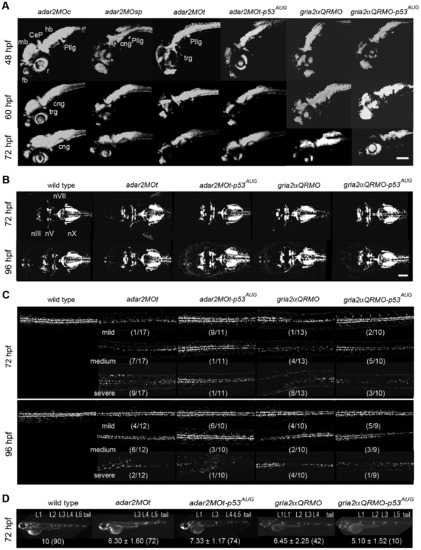
Defective development of the nervous system in the hypo-Q/R-editing morphants. (A) The development of early and mature neurons. Confocal microscopic observations of the kaede fluorescence in Tg(HuC:kaede) receiving morpholino injections. The kaede-expressing domain is reduced in the brain of hypo-Q/R-editing morphants. CeP, cerebellar plate; cng, cranial ganglion; fb, forebrain; hb, hindbrain; pllg, posterior lateral line ganglion; r, retina; trg, trigeminal neuron. (B) The development of cranial motor neurons. Confocal microscopic observations of the GFP in the heads of Tg(isl1:GFP) receiving morpholino injections. The cranial motor neurons are only mildly affected. nIII; oculomotor nuclei; nV; trigeminal nuclei; nX, vagus nuclei. (C) The development of spinal motor neurons. Confocal microscopic observations of the GFP in the trunks of Tg(isl1:GFP) receiving morpholino injections. The spinal motor neurons dorsal to the yolk extension are shown. The effects of morpholino treatments were classified into three groups by relative density of motor neuron in each treatment. The numbers in parenthesis indicate the numbers of larvae in a class over all the observed larvae. Scale bar represents 100 μm. (D) The development of lateral line neuromasts. Epifluorescent microscopic observations of the lateral line neuromasts stained by Di-4-Asp [48]. L1-L5 are the posterior lateral line neuromasts, and tail represents the tail neuromasts. L12 is the secondary PLL neuromast. The average ± s.d. (number of larva) of the primary lateral line neuromasts are shown below. Larvae without tail neuromast were excluded from the analysis. EXPRESSION / LABELING:
PHENOTYPE:
|
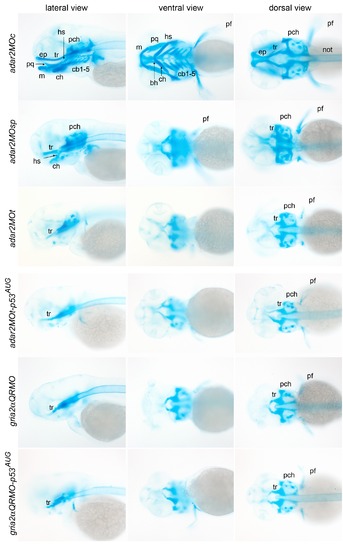
Malformation of the cranial cartilages of hypo-Q/R-editing morphants. Representative images of Alcian blue staining of the head cartilages are presented in three views. Ventral view is taken at a deeper focus from the dorsal side. Abbreviations: bh, basihyal; cb, ceratobranchials; ch, ceratohyal; ep, ethmoid plate; hs, hyosymplectic; m, Meckel′s cartilage; not, notochord; pch, parachordal; pq, palatoquadrate; tr, trabeculae. PHENOTYPE:
|
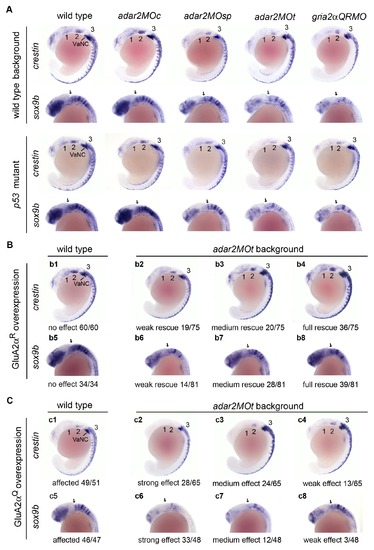
Increased GluA2αQ is sufficient to induce the neural crest defects observed in the adar2MOt. Lateral views of 18-somite stage embryos. (A) Expressions of crestin and sox9b in the hypo-Q/R-editing morphants are affected. Morphants created in the wild type and p53 mutant show negligible differences, indicating that the expression defects in the hypo-Q/R-editing morphants are p53-independent. (B) Overexpression of GluA2αR partially restores the expressions of crestin and sox9b in the adar2MOt. Injection of gria2αR cRNA into the wild type zygotes does not alter the expressions of crestin and sox9b (b1 and b5). However, injection of gria2αR cRNA into the adar2MOt fully or partially rescues the expressions. Effects of rescue range from weak (b2 and b6), medium (b3 and b7) to full (b4 and b8). Weak rescue of crestin expression is defined by slightly enhanced expression in the first (1) and second (2) streams of migration neural crest cells (b2), medium rescue is defined by enhanced anterior expression (b3), and full rescue is defined by restoring the wild type expression pattern and level. Rescue of sox9b expression is classified by the enhancement of overall sox9b expression (b6-b8). Rescue efficiencies are indicated. (C) Overexpression of GluA2αQ affects the expressions of crestin and sox9b. The crestin and sox9b expressions in gria2αQ cRNA-injected embryos (c1 and c5) are affected as that of adar2MOt. The crestin and sox9b expressions are further reduced in adar2MOt by overexpressing GluA2αQ. The additive effect varies from strong (c2 and c6), medium (c3 and c7), to weak (c4 and c8) further reduction of crestin and sox9b expressions. The occurrence rate of each phenotype is shown. 1, 2, 3, the first, second and third steams of migration cranial neural crest; e, eye; ep, epiphysis; f, forebrain; hb, hindbrain; VaNC, vagal neural crest. EXPRESSION / LABELING:
PHENOTYPE:
|
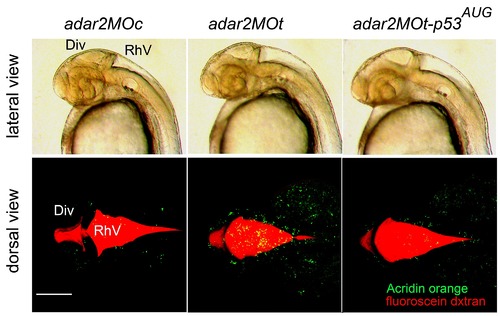
Brain ventricles are enlarged in the 36-hpf adar2MOt and adar2MOt-p53AUG. Upper panel: lateral view of the 36-hpf head region. Lower panel: dorsal view of the brain ventricles and the distribution of apoptotic cells in the head regions. Red fluorescence shows brain ventricles marked by the injected fluorescein-conjugated dextran and the green fluorescence shows the apoptotic cells stained by Acridine orange. The diencephalic (DiV) and rhombencephalic (RhV) ventricles are enlarged in the morphants. Scale bar represents 100 αm. |