
FIGURE
Fig. S2
- ID
- ZDB-FIG-140902-118
- Publication
- Li et al., 2014 - Zebrafish Adar2 Edits the Q/R Site of AMPA Receptor Subunit gria2alpha Transcript to Ensure Normal Development of Nervous System and Cranial Neural Crest Cells
- Other Figures
- All Figure Page
- Back to All Figure Page
Fig. S2
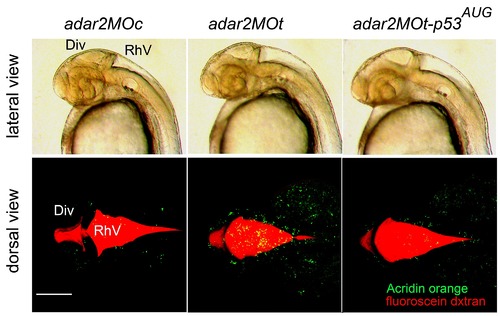
Brain ventricles are enlarged in the 36-hpf adar2MOt and adar2MOt-p53AUG. Upper panel: lateral view of the 36-hpf head region. Lower panel: dorsal view of the brain ventricles and the distribution of apoptotic cells in the head regions. Red fluorescence shows brain ventricles marked by the injected fluorescein-conjugated dextran and the green fluorescence shows the apoptotic cells stained by Acridine orange. The diencephalic (DiV) and rhombencephalic (RhV) ventricles are enlarged in the morphants. Scale bar represents 100 αm. |
Expression Data
Expression Detail
Antibody Labeling
Phenotype Data
Phenotype Detail
Acknowledgments
This image is the copyrighted work of the attributed author or publisher, and
ZFIN has permission only to display this image to its users.
Additional permissions should be obtained from the applicable author or publisher of the image.
Full text @ PLoS One