
|
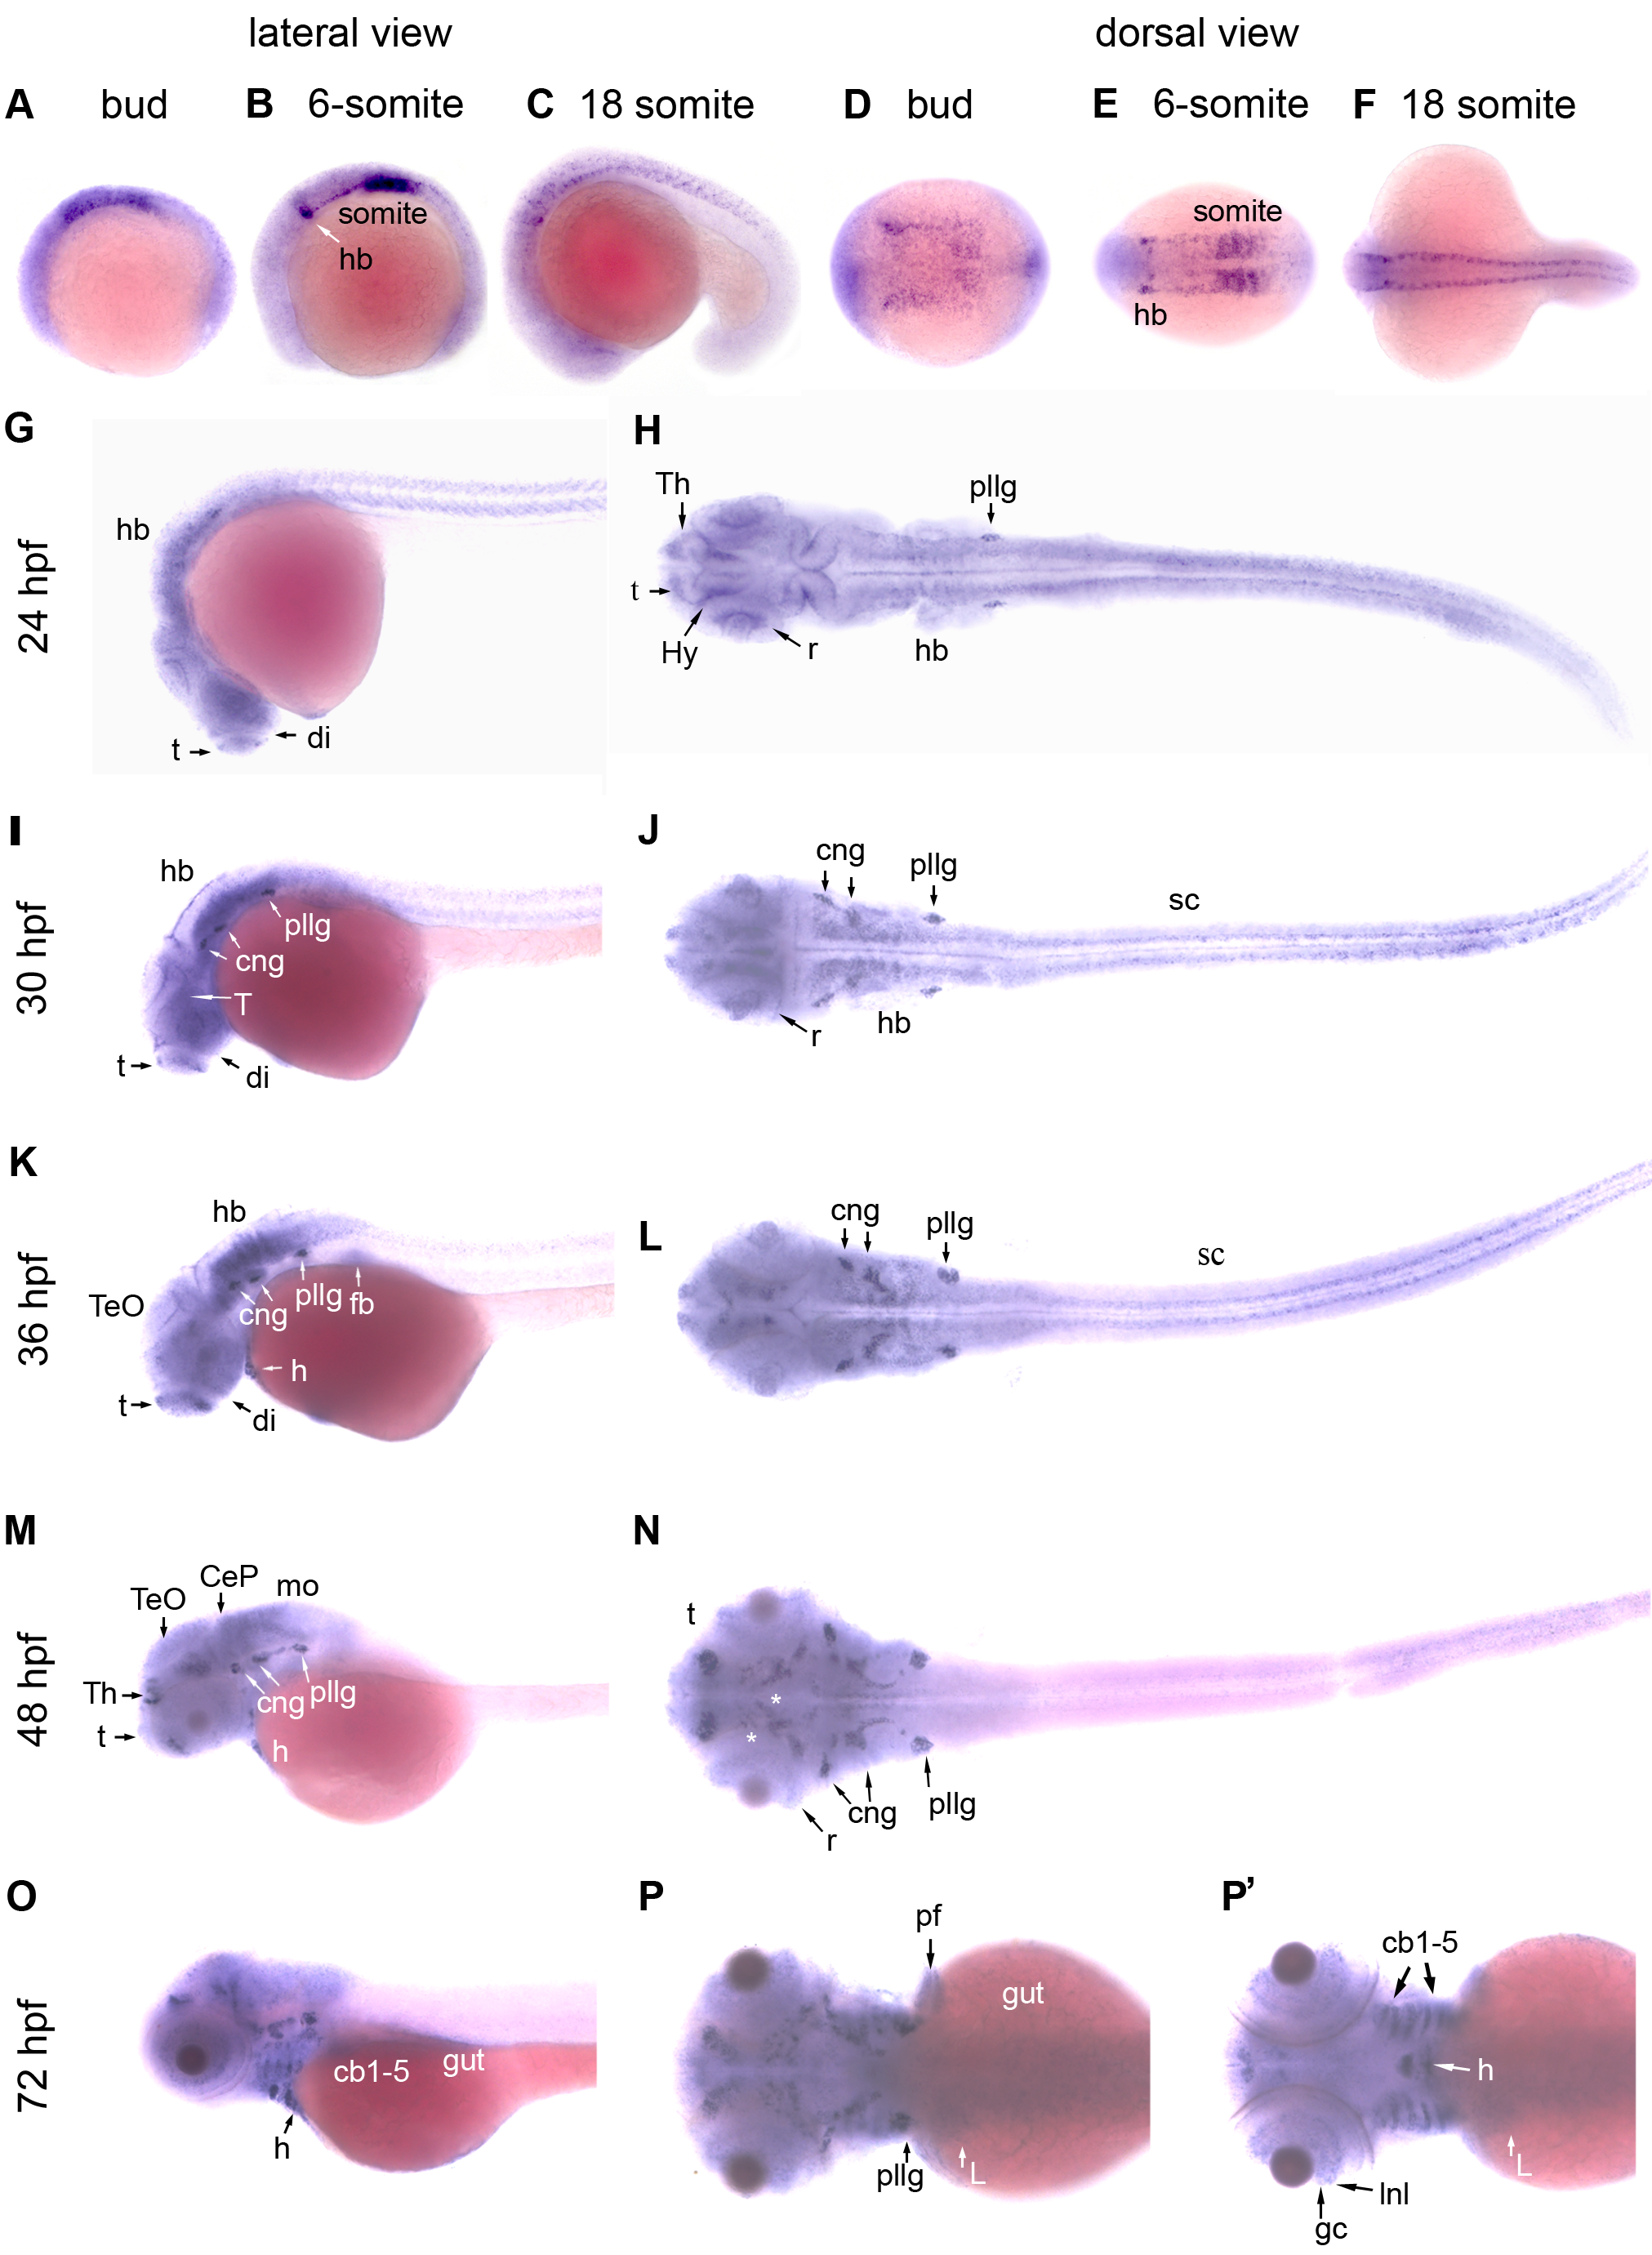
Fig. 1
Expression patterns of zebrafish adar2 during embryogenesis.
The developmental stages are indicated on top and on the left, as hour post fertilization (hpf). (A, B, C, G, I, K, M and O) Lateral views and (D, E, F, H, J, L, N, P and P′) dorsal views of the embryos. The anterior and dorsal sides are respectively to the left and top. (P and P′) Images were taken from two different focuses. P′ Image is slightly deeper showing the adar2 expression in the ventral structures. Abbreviations: cb1-5, ceratobranchials 1–5; CeP, cerebellar plate; cng, cranial ganglion; di, diencephalon; fb, fin bud; gc, retinal ganglion cells; h, heart; hb, hindbrain; Hy, hypothalamus; Inl, inner nuclear layer; L, liver; mo, medullar oblongata; pf, pectoral fin; pllg, posterior lateral line placode/ganglion; r, retina; sc, spinal cord; t, telencephalon; T, tegmentum; TeO, tectum opticm; Th, thalamus.