
- Title
-
Regeneration of breeding tubercles on zebrafish pectoral fins requires androgens and two waves of revascularization
- Authors
- McMillan, S.C., Xu, Z.T., Zhang, J., Teh, C., Korzh, V., Trudeau, V.L., and Akimenko, M.A.
- Source
- Full text @ Development
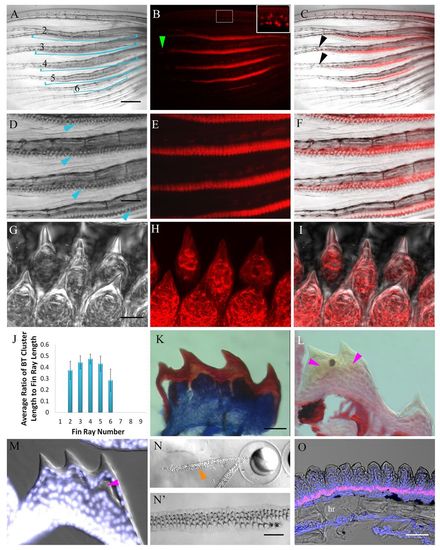
Characterization of male zebrafish pectoral fin BTs. (A-F) Brightfield and fluorescent (red) images of BTs (indicated by blue arrowheads in D and lines in A) on Tg(KR21) male pectoral fins. (B,C) Isolated BTs on fin ray 1 (inset in B) and on the distal tips (green arrowhead in B, black arrowheads in C) of rays 2-6. (D-F) Higher magnifications of A-C. (G-I) DIC images with confocal acquisition of Tg(KR21) BTs. (G) DIC image of BTs. (H) Red fluorescent image of BTs. (I) Merged image of G and H. (J) Length of the BT cluster correlates with the length of the fin ray. Error bars indicate s.d. (K) Mallory stains on a transverse section of a BT keratinized cap (red) and underlying epidermis (blue). (L) Picrosirius Red stain indicates that there is no collagen in BTs. (M) Nuclei are present in all epidermal layers, including the keratin cap of BTs (DAPI stain). (L,M) A second keratin layer is observed underneath the most superficial keratin layer (pink arrowheads). (N,N′) Shed BT clusters (orange arrowhead; magnified in N′) alongside an embryo. (O) Pcna immunohistochemistry (red) and DAPI staining (blue/white) on longitudinal sections indicates epidermal proliferation. hr, hemiray. Scale bars: 200 μm in A-C; 100 μm in D-F; 25 μm in G-I,K-M; 500 μm in N,N′; 50 μm in O. |
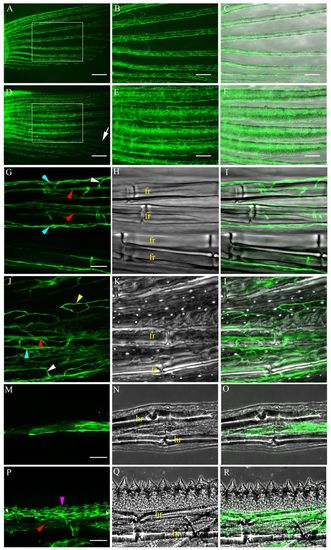
Vasculature in Tg(fli1a:EGFP) pectoral fins. (A-C) Blood vessels (EGFP, green) in female zebrafish. (D-F) BT clusters in males are highly vascularized (boxed in D), but not in surrounding areas (arrow in D). (B,C,E,F) Higher magnification of the boxed regions in A,D. (C,F) Merged brightfield and fluorescent images. (G-R) Confocal micrographs. (G-I) Female with a single artery (red arrowheads), two veins (blue arrowheads) and intervessel commissures (white arrowhead). (J-L) Male with vascularized BTs, an artery (red arrowhead), intervessel commissures (white arrowhead), interray vessels (yellow arrowhead) and veins (blue arrowhead). (M-R) Longitudinal sections. (M-O) Female showing blood vessels that lie between the two hemirays. (P-R) Male showing blood vessels present in a web-like pattern (pink arrowhead) in the epidermis and above the artery (red arrowhead). fr, fin ray; hr, hemiray. Scale bars: 200 μm in A,D; 100 μm in B,C,E,F; 50 μm in G-L; 25 μm in M-O; 50 μm in P-R. |
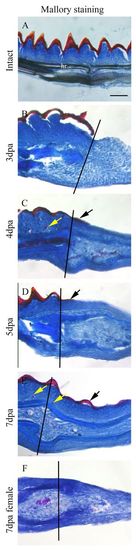
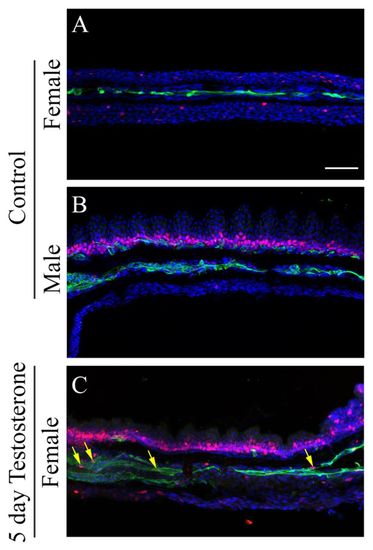
Male pectoral fin BT regeneration. Mallory stain of intact (A) and regenerating (B-F) pectoral fin longitudinal sections. (A,B) Keratinized caps (red) and underlying epidermis (blue) are observed on intact fins (A) but are lost in 3-dpa regenerates (B). (C,D) At 4-5 dpa, a layer of keratin is deposited in the proximal regenerate (black arrows). (E) At 7 dpa, BTs (black arrow) are observed in the fin regenerate. (F) Females do not possess BTs. Yellow arrows indicate blood cells. Black lines (B-F) indicate the amputation plane. dpa, days post-amputation. hr, hemiray. Scale bar: 50 μm. |
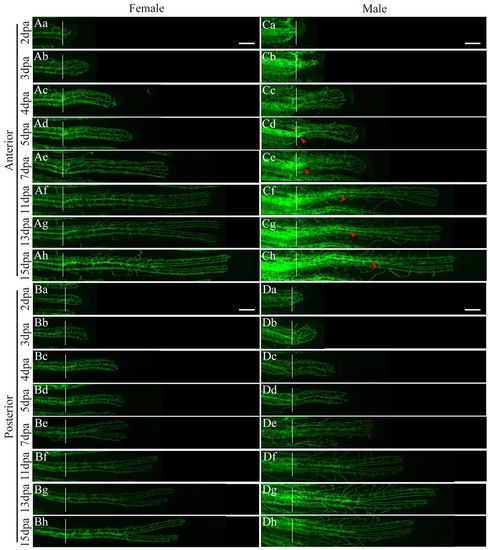
Male and female Tg(fli1a:EGFP) blood vessel regeneration. (Aa-h,Ba-h,Da-h) Blood vessel regeneration follows similar patterns in the female (A,B) and posterior (D) male rays. (Ca-h) Plexus formation (Cb) is delayed in the male anterior ray compared with females (Ab) and appears irregular in shape. (Cd-h) At 5 dpa, a second wave of neo-angiogenesis occurs underneath new BT formation in the male anterior ray and proceeds in a proximal-to-distal manner (red arrowheads). Anterior, fin ray 4; posterior, fin ray 7. White lines indicate the plane of amputation. Scale bars: 100 μm. |
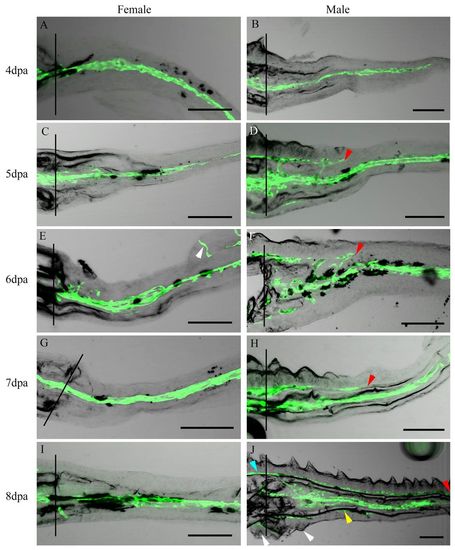
BT cluster regeneration occurs alongside a second wave of neo-angiogenesis. Confocal images of longitudinal sections of regenerating male and female pectoral fins. (A,C,E,G,I) Female blood vessels regenerate along the center of the ray. (E) Arrowhead indicates the distal ray folded back on itself. (B) The first wave of male blood vessel regeneration occurs down the center of the ray. (D,F,H,J) At 5-8 dpa, a second wave travels in a proximal-to-distal fashion along the base of the epidermis (red arrowhead). (J) New BTs (white arrowheads) and blood vessels (yellow arrowhead) are observed in the ventral fin regenerate. Blue arrowhead indicates blood vessels along the base of BTs located in the stump. Black vertical lines indicate the amputation plane. Scale bars: 100 μm. |
BT cluster regeneration occurs alongside a second wave of neo-angiogenesis. Confocal images of longitudinal sections of regenerating male and female pectoral fins. (A,C,E,G,I) Female blood vessels regenerate along the center of the ray. (E) Arrowhead indicates the distal ray folded back on itself. (B) The first wave of male blood vessel regeneration occurs down the center of the ray. (D,F,H,J) At 5-8 dpa, a second wave travels in a proximal-to-distal fashion along the base of the epidermis (red arrowhead). (J) New BTs (white arrowheads) and blood vessels (yellow arrowhead) are observed in the ventral fin regenerate. Blue arrowhead indicates blood vessels along the base of BTs located in the stump. Black vertical lines indicate the amputation plane. Scale bars: 100 μm. |
BT cluster regeneration occurs alongside a second wave of neo-angiogenesis. Confocal images of longitudinal sections of regenerating male and female pectoral fins. (A,C,E,G,I) Female blood vessels regenerate along the center of the ray. (E) Arrowhead indicates the distal ray folded back on itself. (B) The first wave of male blood vessel regeneration occurs down the center of the ray. (D,F,H,J) At 5-8 dpa, a second wave travels in a proximal-to-distal fashion along the base of the epidermis (red arrowhead). (J) New BTs (white arrowheads) and blood vessels (yellow arrowhead) are observed in the ventral fin regenerate. Blue arrowhead indicates blood vessels along the base of BTs located in the stump. Black vertical lines indicate the amputation plane. Scale bars: 100 μm. |
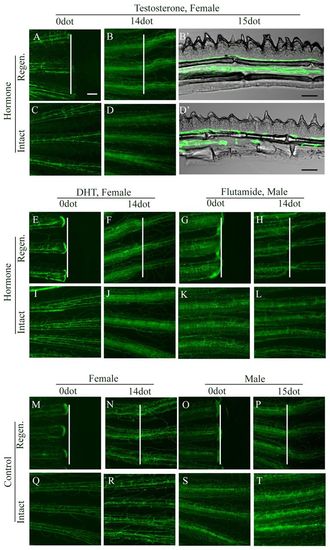
Androgens induce neo-angiogenesis in intact and regenerating pectoral fins. (A-F,I,J) Intact and regenerating fins of T-treated (B,B′,D,D′) and DHT-treated (F,J) females (14 dot) develop vascularized BTs not observed at 0 dot (A,C,E,I). (G,H,K,L) Blood vessels of flutamide-treated (14 dot) male intact and regenerating fins acquire a female-like appearance. (M-T) Control untreated females (M,N,Q,R) and males (O,S,P,T). White lines indicate the amputation plane. Scale bars: 100 μm, except 50 μm in B′,D′. |
Androgens induce neo-angiogenesis in intact and regenerating pectoral fins. (A-F,I,J) Intact and regenerating fins of T-treated (B,B2,D,D2) and DHT-treated (F,J) females (14 dot) develop vascularized BTs not observed at 0 dot (A,C,E,I). (G,H,K,L) Blood vessels of flutamide-treated (14 dot) male intact and regenerating fins acquire a female-like appearance. (M-T) Control untreated females (M,N,Q,R) and males (O,S,P,T). White lines indicate the amputation plane. Scale bars: 100 μm, except 50 μm in B′,D′. |
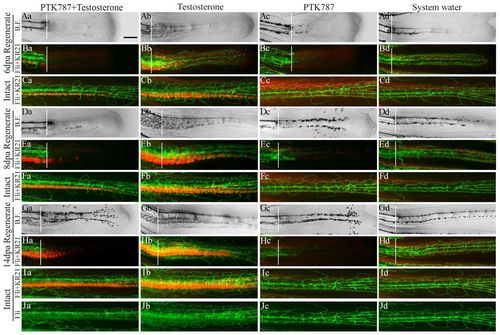
Inhibition of neo-angiogenesis affects T-induced BT growth in the female pectoral fin. (Aa-Ja) A single row of BTs on the intact fin and stump after 6-14 dot with PTK787 and 4-12 dot with T. Small BTs appear in the fin regenerate after 8 dot with PTK787 and 6 dot with T (Da,Ea). A small BT cluster appears on the regenerate after 14 dot with PTK787 and 12 dot with T (Ga,Ha). (Ab-Jb) After 4 dot with T, BTs develop on the regenerate, stump and intact fin and continue to grow from 6-12 dot. (Jb) After 12 dot, the blood vessel network of T-treated females is similar to that of males. (Ac-Jc) PTK787-treated females do not possess BTs. (Aa-Ja,Ac-Jc) Neo-angiogenesis and regenerative outgrowth are inhibited in all PTK787-treated females. (Ad-Jd) System water controls regenerate normally and do not grow BTs. B.F., brightfield. Fli, fli1a:EGFP (green). KR21 (red) outlines the BTs. White vertical lines indicate the amputation plane. Scale bar: 100 μm. |
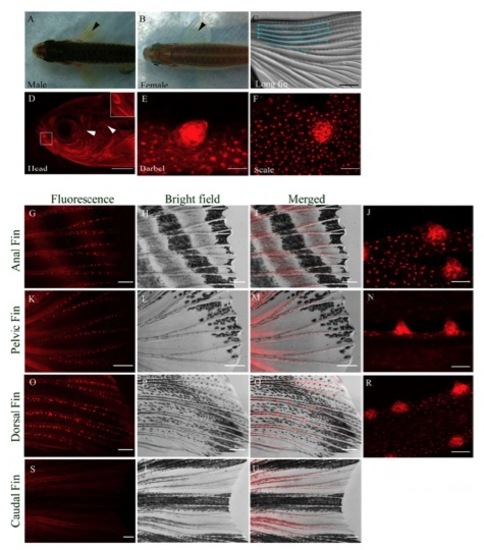
Distribution and morphology of BTs in male zebrafish. (A) Dorsal view of a male zebrafish with pectoral fin BTs (black arrowhead). (B) Dorsal view of a female zebrafish with no BTs and translucent fins (black arrowhead). (C) Pectoral fin of a male longfin mutant with long BT clusters (outlined in blue). (D) Grouped BTs in a line/semi circle (white box) and isolated BTs (white arrowheads) on the side of a male zebrafish head. (E) BT on a barbel. (F) A BT on a scale pulled from the body surface. (G-J) BTs distributed along the anal fin rays. (K-N) BTs along the pelvic fin rays. (O-R) BTs along the dorsal fin rays. (S-U) No BTs are observed on the caudal fin. Fluorescence Tg(KR21) images (red), Merged (Tg(KR21) + Brightfield) images. Scale bar for C = 200μm; D = 400μm; E = 12.5µm; J, N, R, F = 25μm; G-I, K-M, O-Q, S-U = 200μm. |
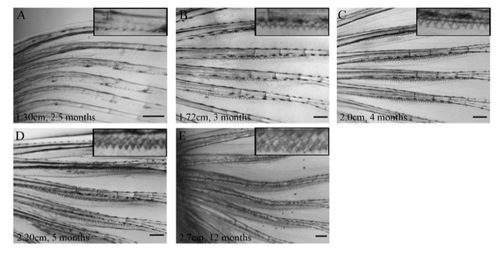
Development of BTs in male zebrafish. (A) BTs are observed as a single row beginning at 1.30 cm standard length or 2.5 months post fertilization. (B) Individual BTs grow larger and form clusters 1.72 cm standard length or 3 months post fertilization. (C,D,E) BT clusters grow until zebrafish reach 1 year of age. Scale bars for all panels = 100μm. |
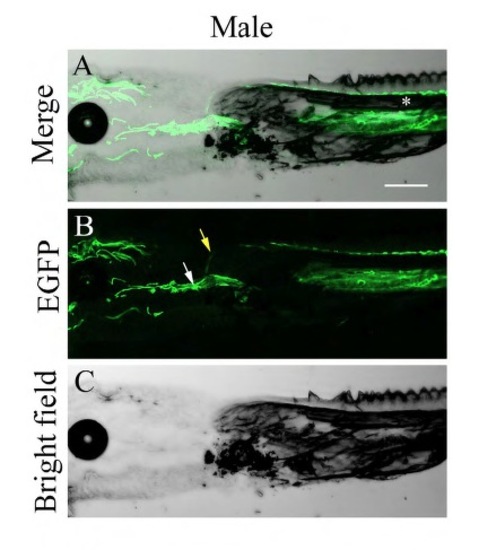
Origin of BT vascularization. Longitudinal sections of the area connecting the body to the pectoral fin of males (A-C) of the Tg(fli1a:EGFP) fish. A blood vessel (yellow arrow) is observed sprouting from the central artery (white arrow) and projecting parallel to the hemiray (white asterisk). (A) Merge = Brightfield + GFP; (B) GFP fluorescence; (C) Brightfield. Scale bars = 100μm (shown in A). |
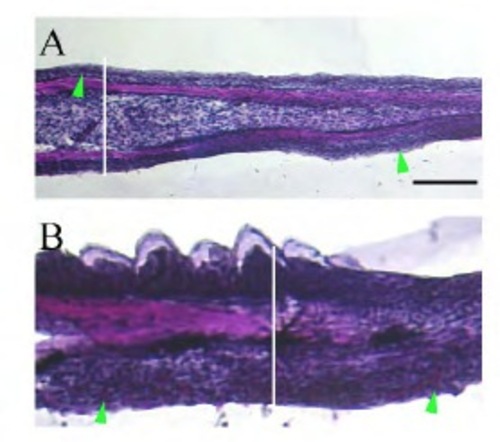
PAS stain on 7 dpa pectoral fin regenerate longitudinal sections. (A) Goblet 2 cells (green arrowheads) in the intact and regenerating dorsal and ventral surfaces of the females. (B) In males, goblet cells (green arrowheads) are present only in regions where BTs are absent. Amputation plane (white vertical lines). Scale bars for both panels = 25μm (shown in A). |
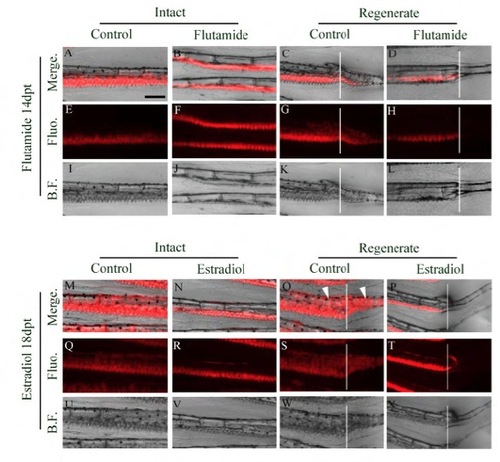
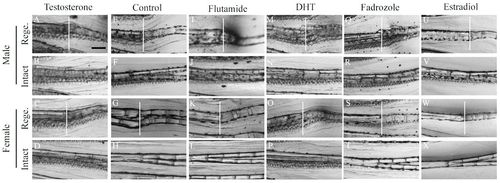
Estradiol and flutamide inhibit BT regeneration and growth in the male pectoral fins. (A,C,E,G,I,K,M,O,Q,U,S,W) BTs along the anterior rays of control intact and regenerating fins. In some cases BT clusters are observed on dorsal and ventral surfaces of the fin rays (white arrowheads in (O)). (B,D,F,H,J,L) Treatment with flutamide (14 dot) results in smaller BTs on the intact fin/stump and no BTs on the fin regenerate. (N,P,R,T,V,X) E2 treatment (18 dot) results in BTs that are reduced in size in the intact fin and regenerate stump and no BTs in the regenerate. White vertical lines indicate amputation plane. Scale bar for all panels = 100μm (shown in A). B.F. = Brightfield; Fluo = KR21/RFP; Merge = Brightfield +KR21/RFP. |
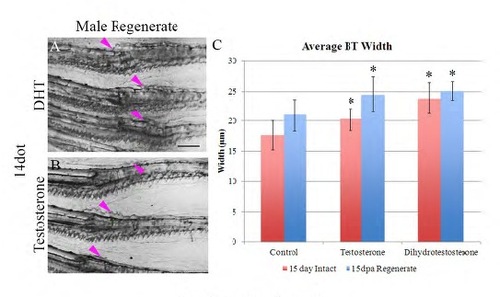
Treatment with androgens increases BT width in males. (A-B) Androgentreated (DHT and T) males (14 dot) displaying BT clusters that cover both dorsal and ventral sides of the regenerate rays (pink arrows). (C) Graph illustrating the average width of each BT. When compared to non-treated controls, T and DHT-treated anterior regenerating and intact fins possess BTs that are significantly wider in width (asterisk). (p < 0.05 via Student’s T-test analysis) Error bars = s.d. Scale bars = 100 μm (shown in A). |
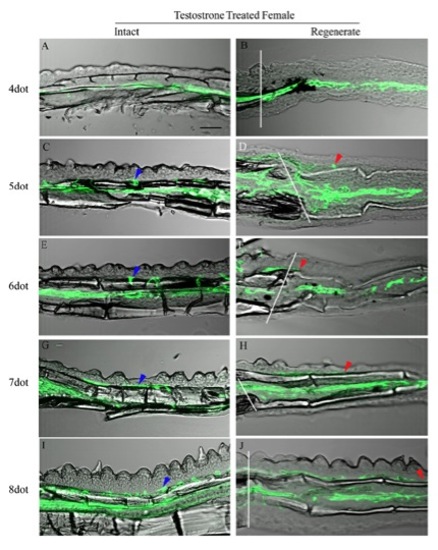
Androgens induce angiogenesis in intact and regenerating female pectoral fins. (A,C,E,G,I) Intact fins of T-treated females develop BTs following 4 dot (A). BTs are vascularized 5 dot (black arrow) (C). (E,G,I) 6-8dot, BTs mature and appear similar to 3 males. (B,D,F,H,J) Regenerating pectoral fins of T-treated females undergo two waves of blood vessel regeneration. (B) The central artery located between the hemirays regenerates in the first wave. (D,F,H,J) Initiated at 5 dpa, the second wave of angiogenesis travels in a proximal-distal fashion parallel to the hemiray (red arrowheads), occurring alongside BT regeneration. Amputation plane is indicated by white vertical lines. Scale bars= 50μm (shown in A). |
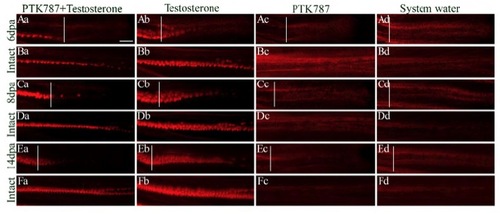
Female pectoral fin BT growth is affected by PTK787. (Aa,Ba) A single row of BTs on the intact fin, and 6dpa regenerate stump after 6 dot with PTK787 and 4 dot testosterone. No BTs were visible in the regenerate (Aa). (Ca,Da) Small individual BTs appear in the fin regenerate after 8 dot with PTK787 and 6 dot with testosterone. BTs are visible on the intact fin and stump. (Ea,Fa) Small BT cluster on the regenerate 14 dot with PTK787 and 12 dot with T. Small BTs on the intact fin and stump. (Ab,Bb) After 4 dot, T-treated females develop BT clusters on the regenerate, stump, and intact fin. (Cb-Fb) BT clusters continue to grow on the intact fin, stump, and regenerate from 6-12 dot with T. (Ac-Fc, Ad-Fd) No BT growth in the intact and regenerating fins with PTK787 treatments or system water controls. White vertical lines indicate the amputation plane. Scale bars for all panels = 100μm. |