
|
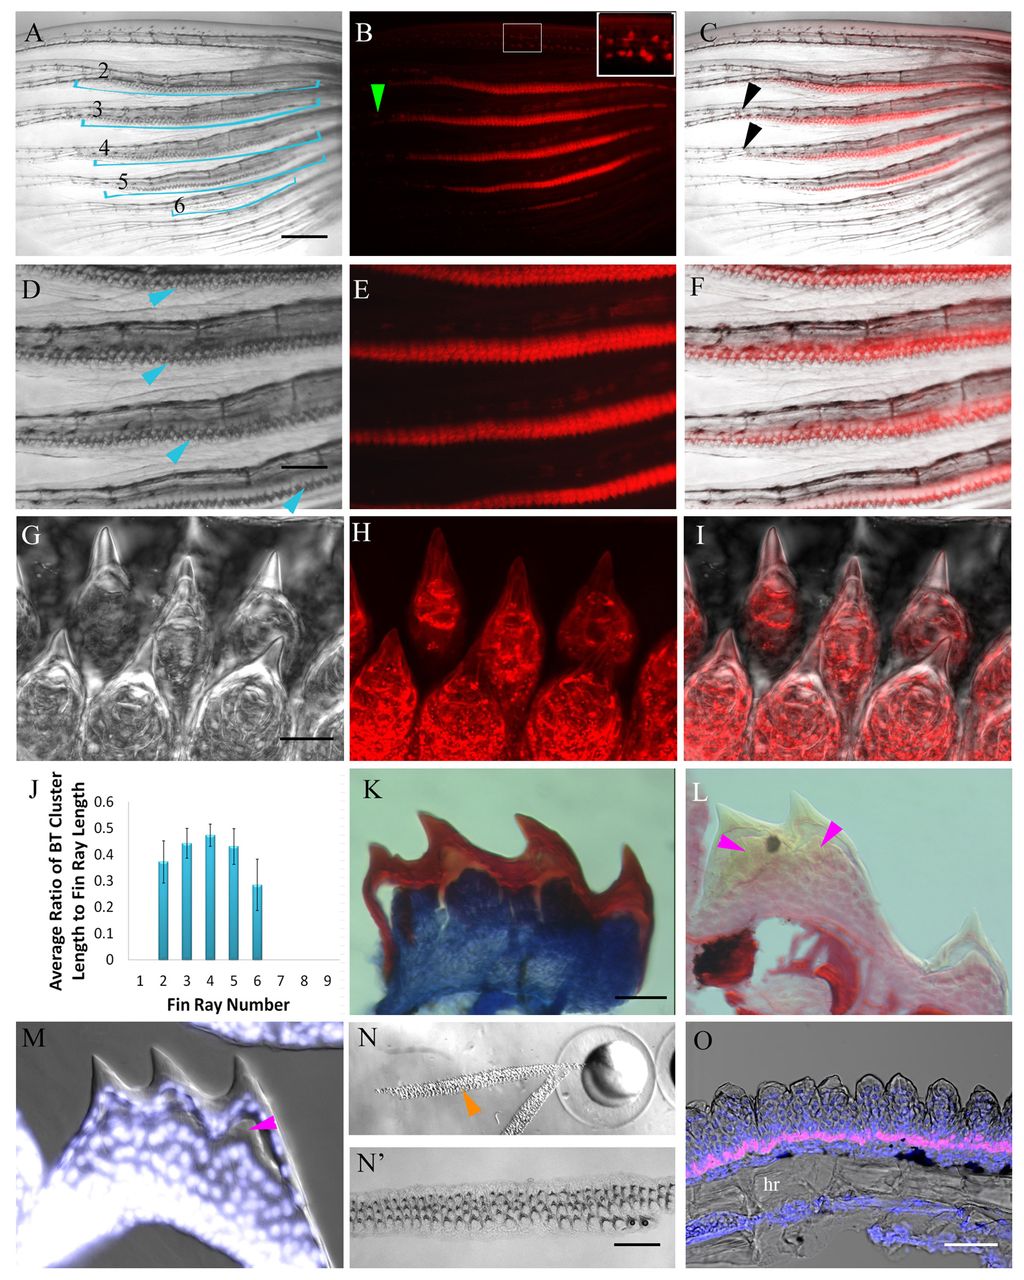
Fig. 1 Characterization of male zebrafish pectoral fin BTs. (A-F) Brightfield and fluorescent (red) images of BTs (indicated by blue arrowheads in D and lines in A) on Tg(KR21) male pectoral fins. (B,C) Isolated BTs on fin ray 1 (inset in B) and on the distal tips (green arrowhead in B, black arrowheads in C) of rays 2-6. (D-F) Higher magnifications of A-C. (G-I) DIC images with confocal acquisition of Tg(KR21) BTs. (G) DIC image of BTs. (H) Red fluorescent image of BTs. (I) Merged image of G and H. (J) Length of the BT cluster correlates with the length of the fin ray. Error bars indicate s.d. (K) Mallory stains on a transverse section of a BT keratinized cap (red) and underlying epidermis (blue). (L) Picrosirius Red stain indicates that there is no collagen in BTs. (M) Nuclei are present in all epidermal layers, including the keratin cap of BTs (DAPI stain). (L,M) A second keratin layer is observed underneath the most superficial keratin layer (pink arrowheads). (N,N′) Shed BT clusters (orange arrowhead; magnified in N′) alongside an embryo. (O) Pcna immunohistochemistry (red) and DAPI staining (blue/white) on longitudinal sections indicates epidermal proliferation. hr, hemiray. Scale bars: 200 μm in A-C; 100 μm in D-F; 25 μm in G-I,K-M; 500 μm in N,N′; 50 μm in O.