
- Title
-
MANF regulates dopaminergic neuron development in larval zebrafish
- Authors
- Chen, Y.C., Sundvik, M., Rozov, S., Priyadarshini, M., and Panula, P.
- Source
- Full text @ Dev. Biol.
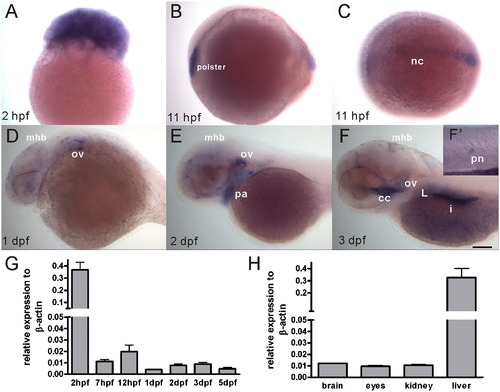
Spatiotemporal expression of the manf transcript during zebrafish embryogenesis and in adult organs. (A–F) manf expression pattern was revealed by whole-mount in situ hybridization, anterior to the left. (A) lateral view of a 2 hpf embryo, (B) lateral view of a 11 hpf embryo, (C) dorsal view of a 11 hpf embryo, (D–F) lateral view of a one dpf, two dpf and three dpf embryo, (F′) high magnification view of a posterior neuromast. (G) manf mRNA levels were analyzed by quantitative PCR. Thirty embryos/group were collected at defined stages. Each experiment was repeated three times using independent RNA isolations. (H) Adult tissues were collected from five individual one-year old male fish and analyzed by qPCR. cc, cranial cavity; i, intestine; L, liver; mhb, midbrain–hindbrain boundary; nc, notochord; ov, otic vesicles; pa, pharyngeal arches; pn, posterior neuromast. Scale bar=100 μm. |
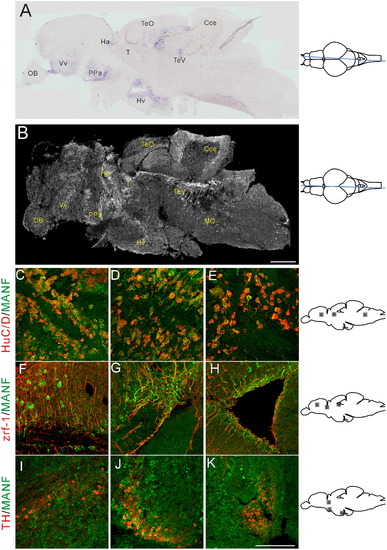
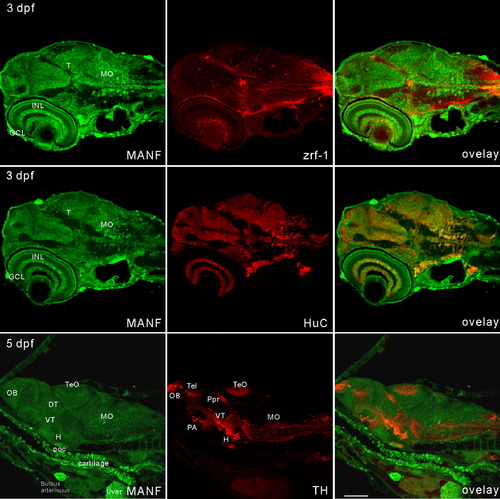
In situ hybridization mRNA analysis and immunocytochemistry of MANF expression in adult zebrafish brain. (A) A sagittal view shows manf mRNA in an adult brain section. Expression can be seen in ventral telencephalic, preoptic, ventral thalamic, pretectal, dorsal thalamic, and hypothalamic regions. (B) A sagittal view of the brain shows immuoreactivity for MANF protein. Expression is shown in telencephalic, preoptic, thalamic, optic tectal, cerebellar and rhombencephalic ventricular regions. MANF antibody co-immunostaining with HuC/D antibody in ventral telencephalic (C), dorsal thalamic (D), and rhombencephalic ventricular regions (E). Co-immunostaining with zrf-1 in dorsal telencephalon (F), ventral thalamic region (G), and telencephalic ventricle (H). Co-immunostaining with TH1 in ventral thalamic area (I), preoptic complex (J), and in caudal hypothalamus (K). MANF staining is shown in green; HuC/D, zrf-1 and TH staining are shown in red. Cce: cerebellar corpus. Ha: habenula. Hv: ventral zone of periventricular hypothalamus. OB: olfactory bulb. PPa: parvocellular preoptic nucleus, anterior part. T: thalamus. TeO: tectum opticum. TeV: tectal ventricle. Vv: ventral nucleus of ventral telencephalic area. Scale bar=300 μm in (B), 100 μm in (K). EXPRESSION / LABELING:
|
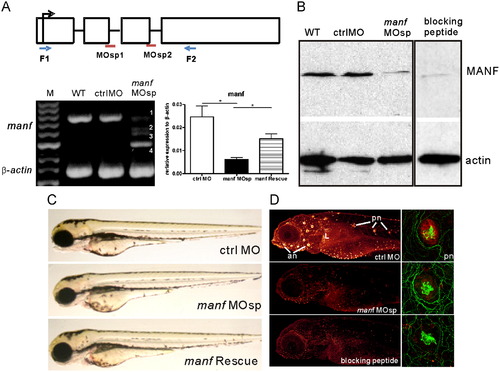
Efficacy of splice-blocking morpholino oligonucletides (MO). (A) The zebrafish manf gene includes four exons. The translation start site is located in the exon 1. The targeting sites of two MOs are in red (MOsp1 and MOsp2). The primer pair used for RT-PCR is shown in blue (F1 and F2). Transcripts of 3-dpf uninjected, control and manf MOsp embryos were used to determine the MO efficiency. Band 1 in the gel electrophoresis indicates the regular manf transcript. Bands 2, 3 and 4 represent the aberrant splicing variants. All PCR products were verified by sequencing. qPCR was performed to quantify the mRNA expression level (*p<0.05, n=3, Student′s t-test). (B) The western blot analysis of MANF expression in the wild type, control MO and manf MOsp- injected groups at 3 dpf. The blot of anti-β-actin was used as an internal control. (C) Bright-field images of control, manf MOsp morphants and manf RNA rescue larvae at 3 dpf. (D) MANF immunostaining on 5-dpf ctrl MO, manf MOsp injected embryos. A higher magnification of a posterior neuromast is shown by double-labeling with MANF shown in red and acetylated tubulin shown in green. The uninjected larvae stained using MANF antibody preabsorbed with MANF blocking peptide to examine the specificity of MANF antibody. MANF positive cells were labeled in bright red. an, anterior neuromast; L, liver; pn, posterior neuromast. Scale bar=100 μm. EXPRESSION / LABELING:
PHENOTYPE:
|
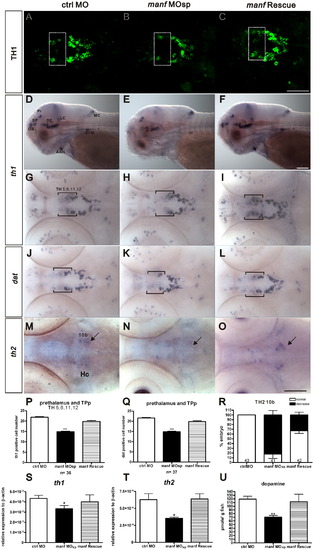
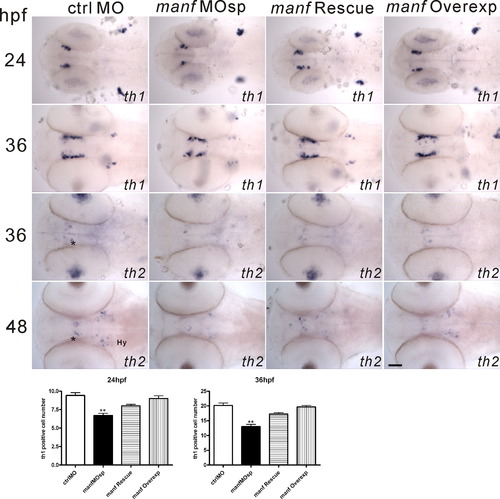
Declines of gene expression of two tyrosine hydroxylases, dopamine transporter and dopamine level in manf MOsp morphants. Spatial distribution of th1, th2 and dat was revealed by whole mount in situ hybridization at 3 dpf control MO, manf MOsp and manf RNA rescued morphants. (A–C) A dorsal view of TH 1 immunohistochemistry. (D–F) A lateral view of th1 expression pattern. (G–I) A dorsal view of th1 expression pattern. (J–L) A dorsal view of dat expression pattern. (M–O) A dorsal view of th2 expression pattern. Quantitative analysis of the number of th1-containing cells (P) and dat-positive cells (Q) in prethalanus and TPp dopaminergic populations 5,6,11 and 12 defined by Sallinen et al., 2009b; DC1 and DC2 group defined by ( Rink and Wullimann, 2002 and Schweitzer et al., 2012). (R) The percentage of embryos with normal and decreased th2-positive signal (***p<0.001, one-way ANOVA with Dunnett′s test). (S–T) qPCR analysis of th1 and th2 transcript levels (*p<0.05, n=3, Student′s t test). (U) dopamine concentration measured by HPLC at 4 dpf (**p<0.01, n=4, Student′s t test). The frame shown in the G–L indicates the deficiency of th1 cell populations (TH1 populations 5,6,11 and 12) in a manf MOsp morphant. The arrow in M–O indicates the site of the deficiency of th2 cell population in caudal hypothalamus (Hc, group 10b) in a manf MOsp morphant. AAN: arch-associated neurons; DC: diencephalic catecholaminergic cluster; LC: locus coeruleus; MC: medulla catecholamergic cluster; OB: olfactory bulb. Pr: dorsal pretectum; Sym: sympathetic neurons; TPp: periventricular nucleus of posterior tuberculum. Scale bar=100 μm. EXPRESSION / LABELING:
PHENOTYPE:
|
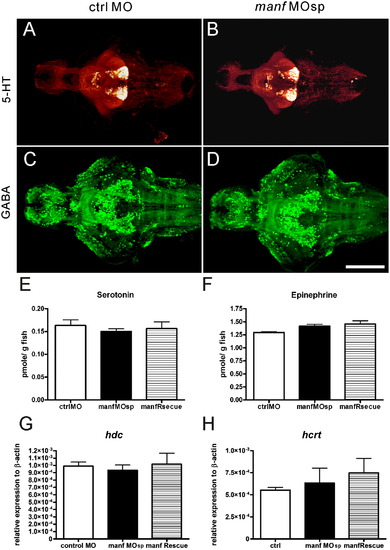
Knockdown of manf did not alter the serotonergic system, GABAergic system, hdc and hcrt expression in manf deficient embryos. (A and B) 5-HT and (C and D) GABA immunostainingin control MO and manf MOsp morphants in 5 dpf brains. (E) The serotonin level and (F) the epinephrine level measured by HPLC. qPCR analysis of hdc (G) and hcrt (H) transcript levels in 3 dpf larvae (p>0.05, n=3, Student′s t-test). Scale bar=100 μm. EXPRESSION / LABELING:
PHENOTYPE:
|
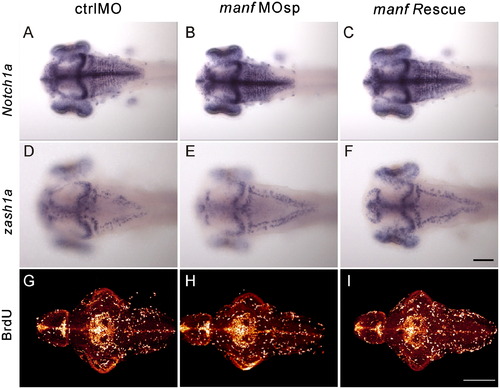
Expression pattern of Notch1a, zash1a and BrdU labeled cells did not alter. Spatial distribution of Notch1a and zash1a was revealed by whole mount in situ hybridization at 2 dpf control MO, manf MOsp and manf RNA rescued morphants. BrdU saturation label analysis was performed in 5 dpf fish. (A–C) The dorsal view of Notch1a expression pattern. (D–F) The dorsal view of zash1a expression pattern. (G–I) The dorsal view of BrdU labeled cells. Scale bar=100 μm. |
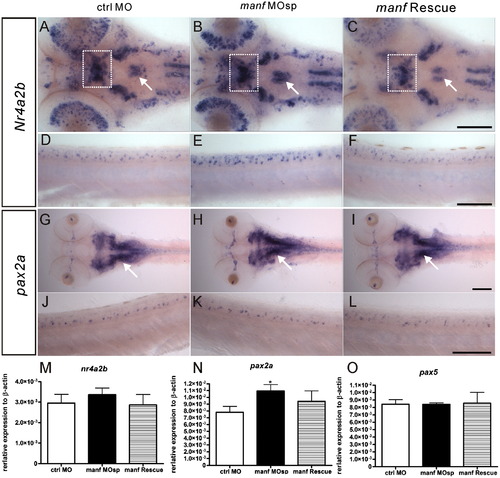
Increase of nr4a2b and pax2a expression in manf MOsp morphants at 3 dpf. The spatial distribution of nr4a2b and pax2a was revealed by whole mount in situ hybridization. (A–C) dorsal views of nr4a2b expression pattern in the head and (D–F) lateral views of the spinal cord. (G–H) dorsal views of pax2a expression pattern in the head and (J–L) lateral views of the spinal cord. qPCR analysis of nr4a2b (M), pax2a (N) and pax5(O) (*p<0.05, n=3, Student′s t-test). White rectangles indicate the increase of nr4a2b expression in the posterior tuberculum and white arrows indicate the increased nr4a2b and pax2a expression in rhombencephalon in manf MOsp morphants. Scale bar=100 μm. EXPRESSION / LABELING:
PHENOTYPE:
|
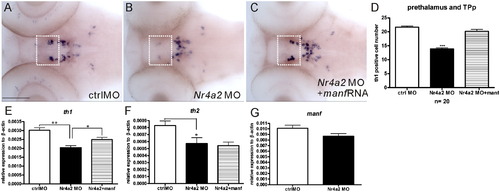
MANF partially rescued the loss of th1 cells in 3 dpf Nr4a2 morphants. (A–C) th1 expression pattern was revealed by whole mount in situ hybridization at 3 dpf control MO, Nr4a2 MO and Nr4a2 MO co-injected with manf mRNA embryos, anterior to the left and dorsal to the top. (D) Quantitative analysis of the number of th1-containing cells in prethalanus and TPp dopaminergic population 5,6,11 and 12 defined by Sallinen et al., 2009b; DC1 and DC2 group defined by Rink and Wullimann, 2002. (***p<0.001, one-way ANOVA with Dunnett′s test) (E and F) qPCR analysis of th1, th2 and manf transcript levels (*p<0.05, n=3, Student′s t test). White rectangles indicate the loss of th1 cell population in population 5,6,11 and 12. TPp: periventricular nucleus of posterior tuberculum. Scale bar=100 μm. EXPRESSION / LABELING:
PHENOTYPE:
|
|
|
Reprinted from Developmental Biology, 370(2), Chen, Y.C., Sundvik, M., Rozov, S., Priyadarshini, M., and Panula, P., MANF regulates dopaminergic neuron development in larval zebrafish, 237-249, Copyright (2012) with permission from Elsevier. Full text @ Dev. Biol.