
|
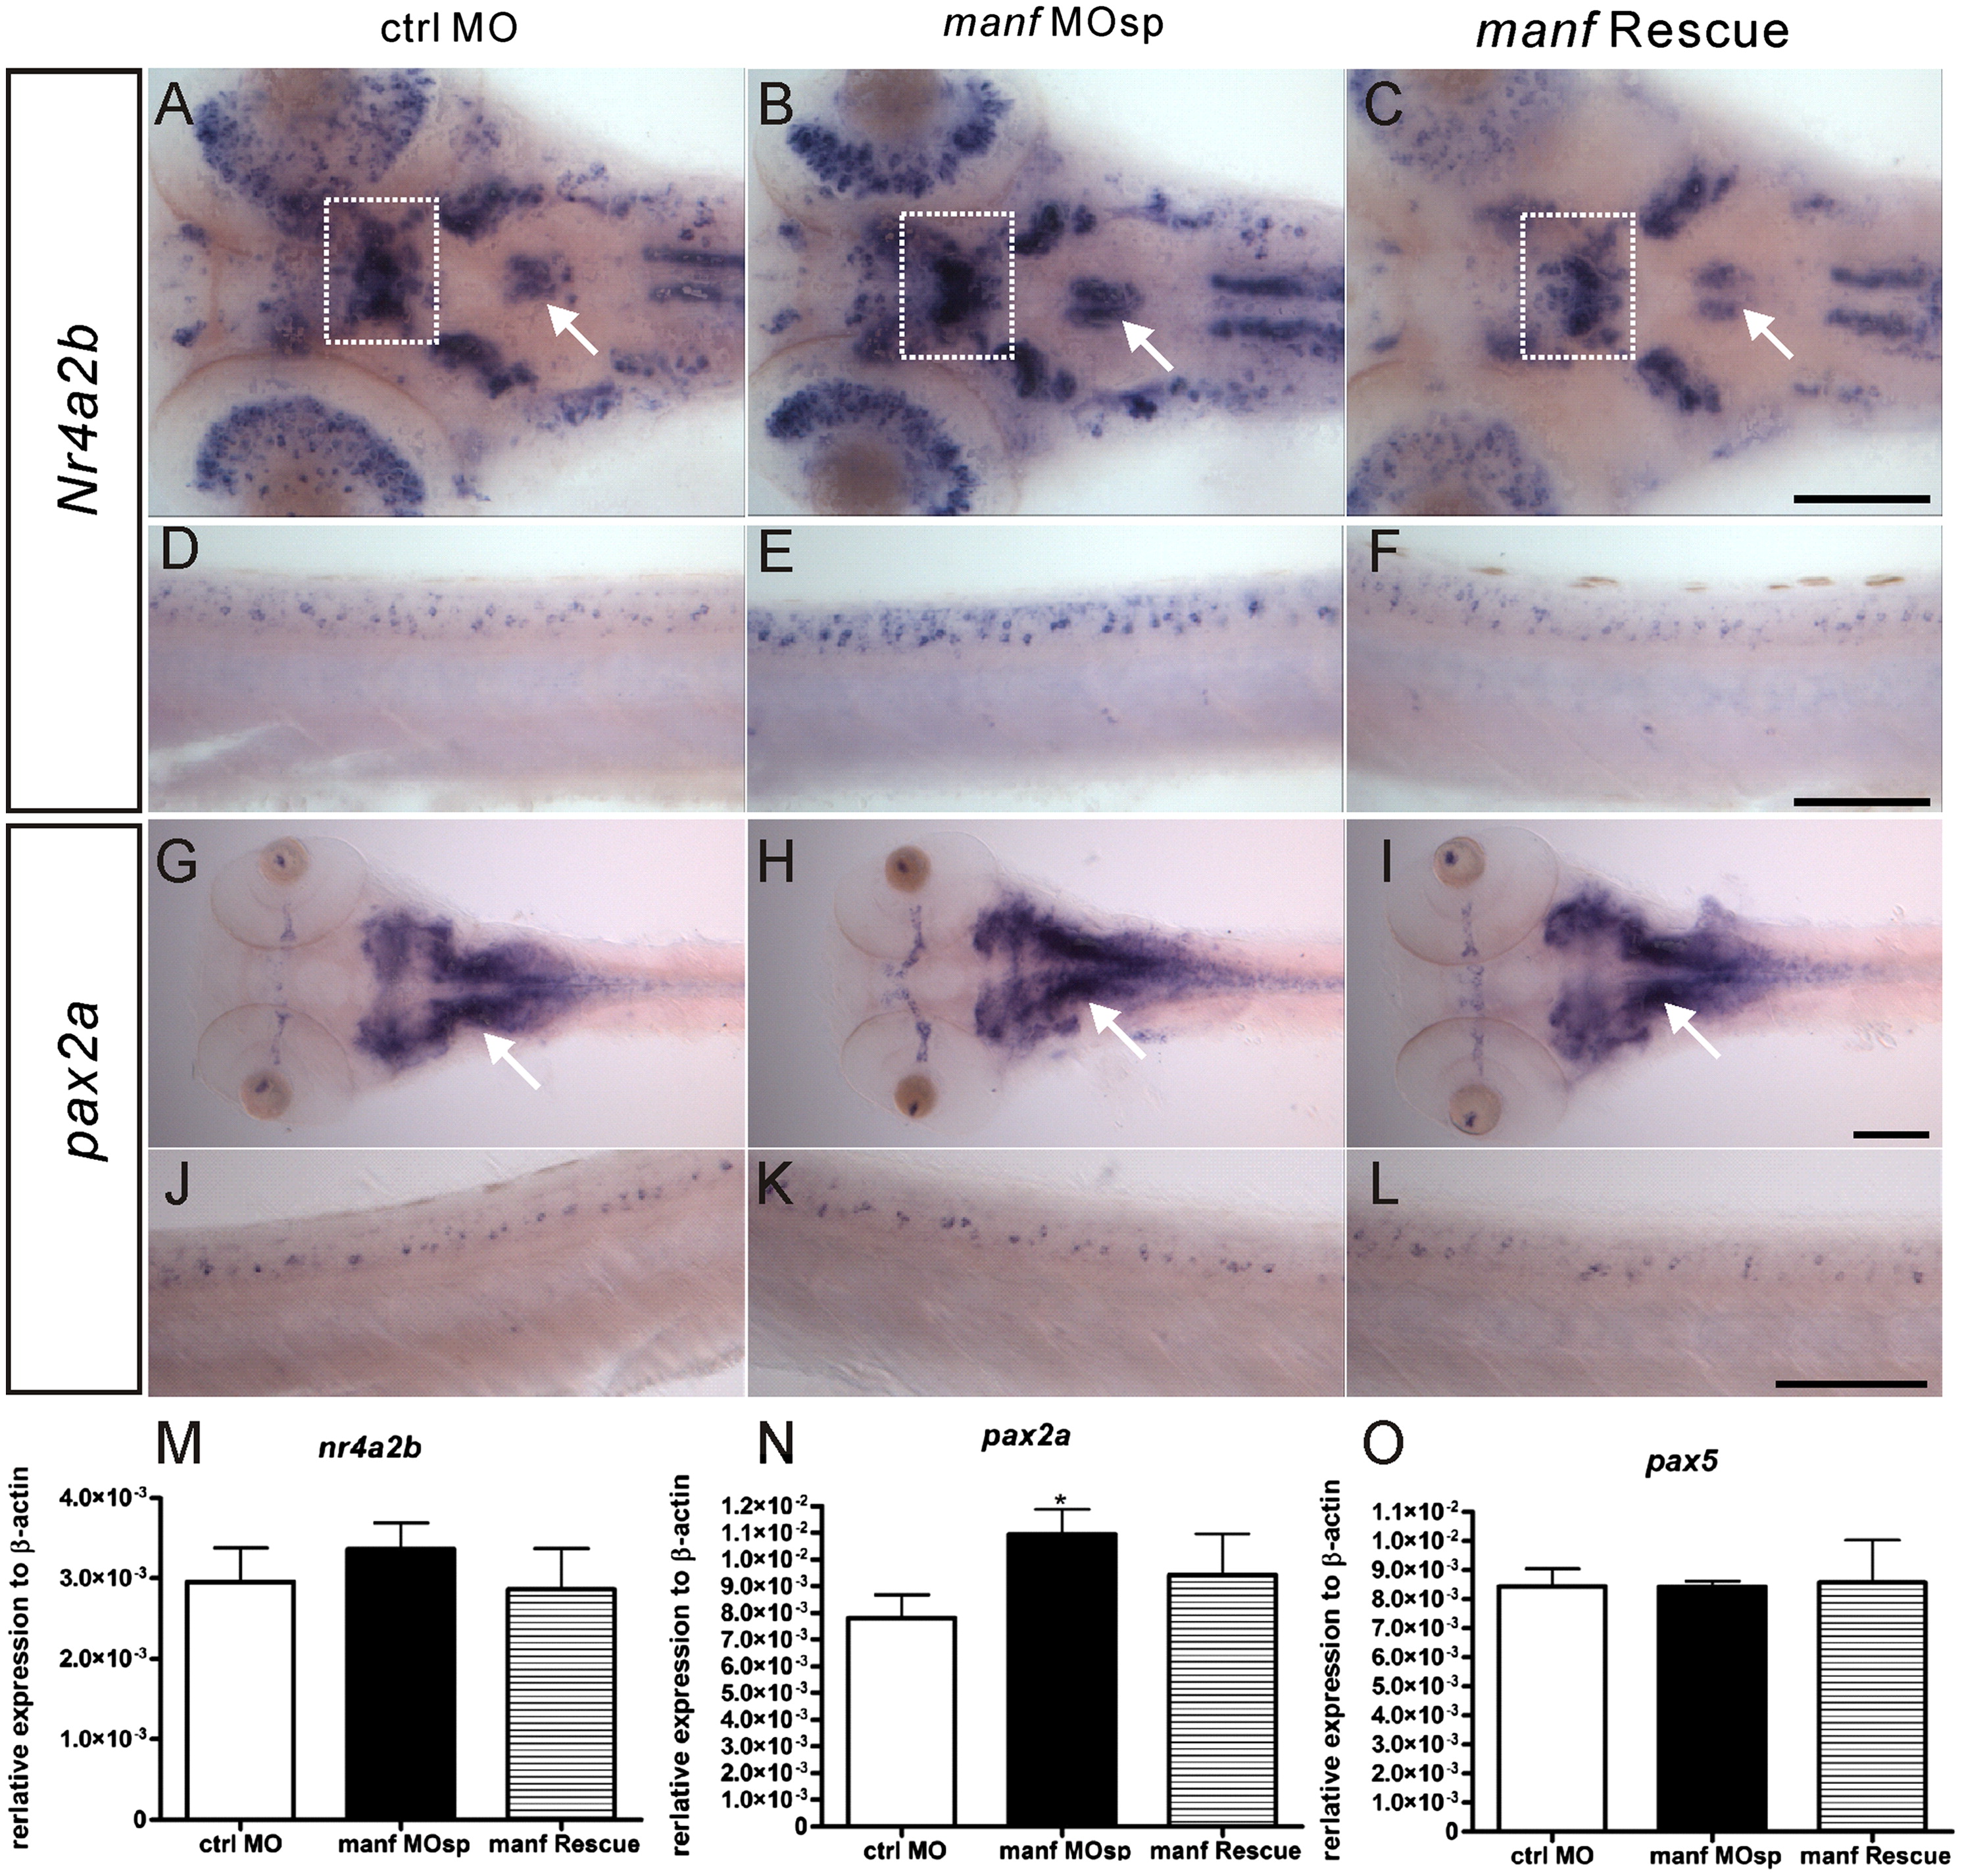
Fig. 7 Increase of nr4a2b and pax2a expression in manf MOsp morphants at 3 dpf. The spatial distribution of nr4a2b and pax2a was revealed by whole mount in situ hybridization. (A–C) dorsal views of nr4a2b expression pattern in the head and (D–F) lateral views of the spinal cord. (G–H) dorsal views of pax2a expression pattern in the head and (J–L) lateral views of the spinal cord. qPCR analysis of nr4a2b (M), pax2a (N) and pax5(O) (*p<0.05, n=3, Student′s t-test). White rectangles indicate the increase of nr4a2b expression in the posterior tuberculum and white arrows indicate the increased nr4a2b and pax2a expression in rhombencephalon in manf MOsp morphants. Scale bar=100 μm.
Reprinted from Developmental Biology, 370(2), Chen, Y.C., Sundvik, M., Rozov, S., Priyadarshini, M., and Panula, P., MANF regulates dopaminergic neuron development in larval zebrafish, 237-249, Copyright (2012) with permission from Elsevier. Full text @ Dev. Biol.