
- Title
-
lyve1 expression reveals novel lymphatic vessels and new mechanisms for lymphatic vessel development in zebrafish
- Authors
- Okuda, K.S., Astin, J.W., Misa, J.P., Flores, M.V., Crosier, K.E., and Crosier, P.S.
- Source
- Full text @ Development
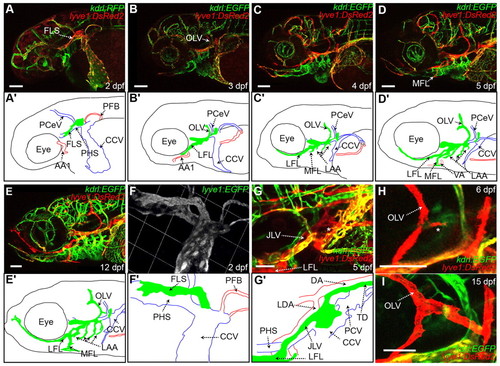
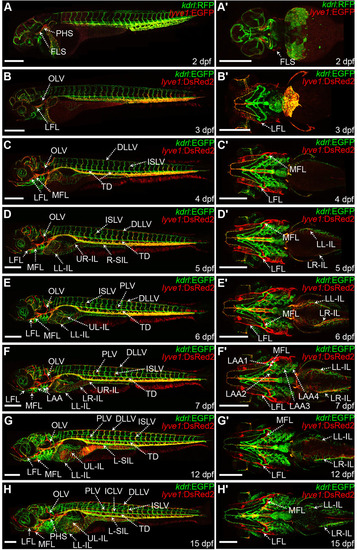
The facial lymphatics originate from the common cardinal vein to form a complex network of vessels. (A-E′) Lateral images of head vessels in the lyve1:EGFP;kdrl:RFP and lyve1:DsRed2;kdrl:EGFP transgenics at 2-12 dpf (A-E), with schematic diagrams of arteries (red), veins (blue) and lymphatics (green) at each stage (A′-E′). (F,F′) 3D reconstruction of the FLS in the lyve1:EGFP transgenic at 2 dpf (F), with schematic diagram (F′′). (G,G′) Dorsolateral image of the JLV and its connection to the TD and the CCV (indicated by a white asterisk) in the lyve1:EGFP;kdrl:RFP transgenic at 5 dpf (G), with schematic diagram (G2). (H,I) Images showing the OLV branching at 6 dpf (H) (indicated by a white asterisk) and connecting to the remnant lyve1-expressing structure attached to the CCV at 15 dpf (12/16) (I) in the lyve1:DsRed2;kdrl:EGFP transgenic. A-E are montage images. A used three z series stacks and B-E used two z series stacks. AA1, mandibular arch; CCV, common cardinal vein; DA, dorsal aorta; FLS, facial lymphatic sprout; JLV, jugular lymphatic vessel; LDA, lateral dorsal aorta; LFL, lateral facial lymphatic; LAA, lymphatic branchial arches; MFL, medial facial lymphatic; OLV, otolithic lymphatic vessel; PCeV, posterior cerebral vein; PCV, posterior cardinal vein; PFB, pectoral fin bud; PHS, primary head sinus; VA, ventral aorta. Scale bars: 100 μm in A-G′; 50 μm in H,I. |
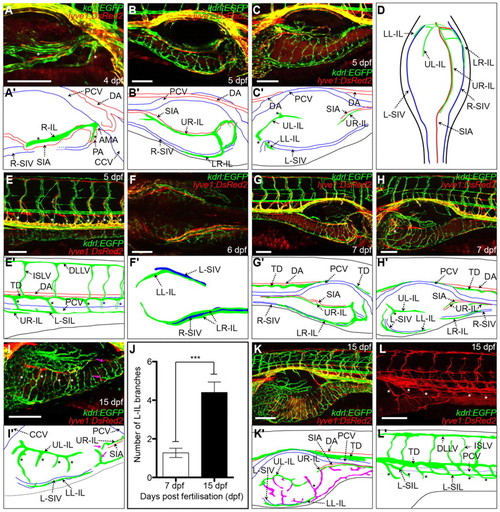
The intestinal lymphatics span the entire intestine and its development is closely associated with the intestinal blood vasculature. All the images used in this figure are generated from the lyve1:DsRed2;kdrl:EGFP transgenic. (A,A′) Lateral image of the right-hand side of the embryo showing the initial lyve1-positive vessel (indicated by asterisks) forming along the AMA, SIA and the PA at 4 dpf (A), with schematic diagram of arteries (red), veins (blue) and lymphatics (green) (A′). (B,B′) Dorsolateral image of the right side of the embryo showing the UR-IL and the LR-IL developing along the SIA and the R-SIV, respectively (B), with schematic diagram (B′). (C,C′) Lateral image of the left side of the embryo showing the UL-IL and the LL-IL that develops along the L-SIV (C), with schematic diagram (C′). Asterisks indicate the connection between the L-IL and the R-IL. The posterior regions of the SIA and the UR-IL are also visible. (D) Dorsal view of the intestinal vessels at 5 dpf. Dotted green lines represent proposed vessel connections between the L-IL and the R-IL. (E,E′) Lateral image showing the connections (indicated by asterisks) between the SILs and the TD at 5 dpf. Blue and black asterisks represent connections between the R-SIL and L-SIL with the TD, respectively. (F,F′) Ventral image showing a pair of LR-IL that forms in close proximity along the R-SIV at 6 dpf (F), with schematic diagram (F′). (G-H′) Lateral images of the right (G), and the left (H) side of the embryo showing the intestinal vessels at 7 dpf, with schematic diagrams (G′,H′). The L-IL branch is labelled with an asterisk in H and H′. (I,I′) Lateral image of the left side of the embryo showing the L-IL branches (indicated by asterisks) and branches extending from the R-IL to the left side of the intestine (indicated by pink arrows) at 15 dpf (I), with schematic diagram (I′). (J) Quantification of the number of L-IL branches at 7 dpf (average 1.3, n=22) and 15 dpf (average 4.4, n=10). Error bar represents 95% confidence interval. ***P<0.001. (K,K′) Lateral image of the right side of the embryo showing the intestinal vessels at 15 dpf (K), with schematic diagram (K′). Lymphatic vessels whose positions are variable between individual embryos are in pink. Connection between the L-IL and the R-IL is indicated with an asterisk. (L,L′) Lateral image showing the SIL branches (indicated by asterisks) at 15 dpf (L), with schematic diagram (L′). Only the lyve1:DsRed2 expression was shown for clarity. B,E,G,H,I,K,L are montage images. B,E,G,H,I used two z series stacks. K used six z series stacks. L used four z series stacks. AMA, anterior mesenteric artery; CCV, common cardinal vein; DA, dorsal aorta; DLLV, dorsal longitudinal lymphatic vessel; ISLV, intersegmental lymphatic vessel; L-IL, left intestinal lymphatics; LL-IL, lower-left intestinal lymphatic; LR-IL, lower-right intestinal lymphatic; L-SIL, left supraintestinal lymphatic vessel; L-SIV, left subintestinal vein; PA, pancreatic anlage; PCV, posterior cardinal vein; R-IL, right intestinal lymphatics; R-SIV, right subintestinal vein; SIA, supraintestinal artery; TD, thoracic duct; UL-IL, upper-left intestinal lymphatic; UR-IL, upper-right intestinal lymphatic. Scale bars: 100 μm in A-H; 200 μm in I-L. |
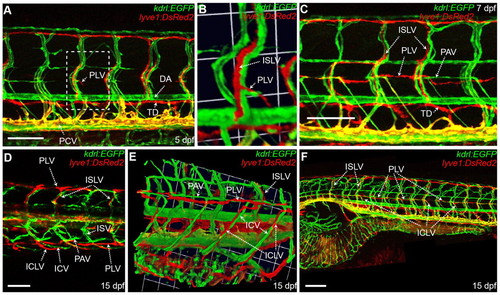
The lateral lymphatics sprout from the intersegmental lymphatic vessel and form along the parachordal vessel and the intercostal vessel. All the images used in this figure are generated from the lyve1:DsRed2;kdrl:EGFP transgenic. (A) Lateral image of the trunk vessels at 5 dpf. (B) 3D reconstruction of the white box in A showing the initial sprout of the PLV originating from the ISLV. (C) Lateral image of the trunk vessels at 7 dpf, showing fusion of the PLV fragments. (D) Dorsal image of the trunk vessels at 15 dpf. (E) 3D reconstruction of the trunk vessels at 15 dpf, showing the dorsal migration of the ICLVs along the ICV. (F) Lateral image of the lateral lymphatics at 15 dpf. F is a montage image of eight z series stacks. DA, dorsal aorta; ICV, intercostal vessel; ICLV, intercostal lymphatic vessel; ISLV, intersegmental lymphatic vessel; ISV, intersegmental vessel; PAV, parachordal vessel; PCV, posterior cardinal vein; PLV, parachordal lymphatic vessel; TD, thoracic duct. Scale bars: 100 μm in A,C,D; 200 μm in F. |
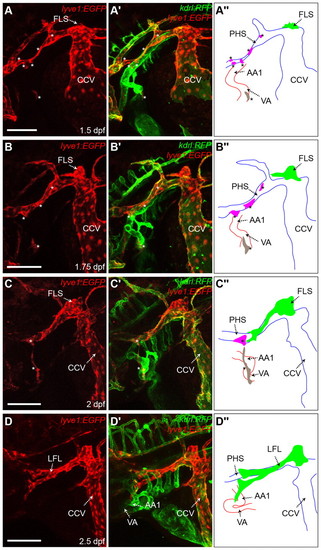
Distinct lymphangioblast populations contribute to the development of the LFL. (A-D′′) Lateral images of lyve1:EGFP expression (A-D) and both lyve1:EGFP and kdrl:RFP expression (A′-D′) of the lyve1:EGFP;kdrl:RFP transgenic at 1.5 dpf (A), 1.75 dpf (B), 2 dpf (C) and 2.5 dpf (D), with schematic diagrams of arteries (red), veins (blue) and lymphatic (green) at each stage (A′′-D′′). Lymphangioblast populations are indicated by asterisks. The PHS-L is in pink; the VA-L is in grey. AA1, mandibular arch; CCV, common cardinal vein; FLS, facial lymphatic sprout; LFL, lateral facial lymphatic; PHS, primary head sinus; PHS-L, primary head sinus lymphangioblast; VA, ventral aorta; VA-L, ventral aorta lymphangioblast. Scale bars: 100 μm. |
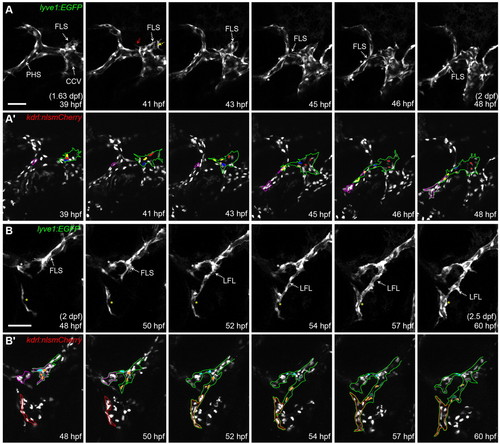
The LFL develops from a vascular sprout with migration, duplication, and recruitment of lymphangioblast populations to the vascular tip. (A,A′) Still images from supplementary material Movie 2 showing the developing LFL in the lyve1:EGFP;kdrl:nlsmCherry transgenic from 1.63 to 2 dpf (39 to 48 hpf). (A) lyve1 expression shows the vascular tip of the FLS, which resembles a dynamic vascular sprout with filopodia (red arrow) and lamellipodia (yellow arrow), and the migration and the recruitment of PHS lymphangioblasts (indicated by a white asterisk) to the vascular tip of the FLS. (A′) Nuclear kdrl expression shows duplication of a lymphangioblast cell (yellow and red) within the FLS (green outline), the migration of lymphangioblast cells (yellow, red, blue and beige) and the recruitment of PHS-Ls (purple outline). (B,B2) Still images from supplementary material Movie 3 showing the developing LFL in the same lyve1:EGFP;kdrl:nlsmCherry transgenic embryo as in A from 2 to 2.5 dpf (48 to 60 hpf). (B) lyve1 expression shows the migration and recruitment of another PHS-L (white asterisk) and the VA lymphangioblast (yellow asterisk) to the growing tip of the FLS to form the LFL. (B′) Nuclear kdrl expression shows duplication of lymphangioblast cells (green and light blue) within the FLS (green outline), and the migration of lymphangioblast cells from the PHS-L that have been recruited to the FLS (orange, green and light blue) to another PHS lymphangioblast (pink outline) and the VA lymphangioblast (red outline). CCV, common cardinal vein; FLS, facial lymphatic sprout; LFL, lateral facial lymphatic; PHS, primary head sinus; PHS-L, primary head sinus lymphangioblast. Scale bars: 50 μm. |
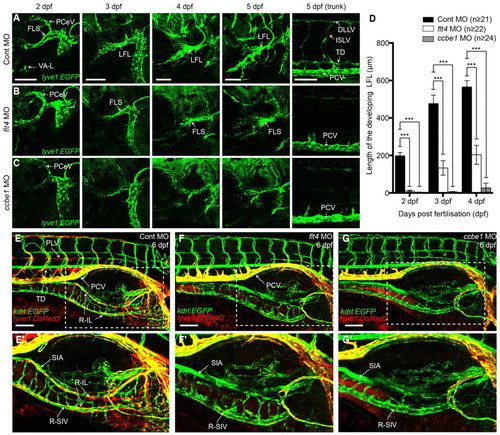
The development of the FL, IL and LL requires flt4 and ccbe1. (A-C) Lateral images of the lyve1:EGFP transgenic, showing altered FL and trunk lymphatics development in flt4 (B) and ccbe1 (C) morpholino-injected embryos compared with control morpholino-injected embryos (A) at 2-5 dpf. (D) Quantification of the length of the developing LFL in control, flt4 and ccbe1 morpholino-injected embryos at 2, 3 and 4 days post fertilisation. Error bars represent 95% confidence intervals. ***P<0.001. (E-G′) Lateral images of the lyve1:DsRed2;kdrl:EGFP transgenic showing lack of IL and LL development in flt4 (F) and ccbe1 (G) morpholino-injected embryos compared with the normal IL and LL development in the control morpholino-injected embryos (E). E′-G′ are higher magnification images of the boxes in E-G. E-G are montage images of two z series stacks. DLLV, dorsal longitudinal lymphatic vessel; FLS, facial lymphatic sprout; ISLV, intersegmental lymphatic vessel; LFL, lateral facial lymphatic; PCeV, posterior cerebral vein; PCV, posterior cardinal vein; PLV, parachordal lymphatic vessel; R-IL, right intestinal lymphatics; R-SIV, right subintestinal vein; SIA, supraintestinal artery; TD, thoracic duct. VA-L, ventral aorta lymphangioblasts. Scale bars: 100 μm. |
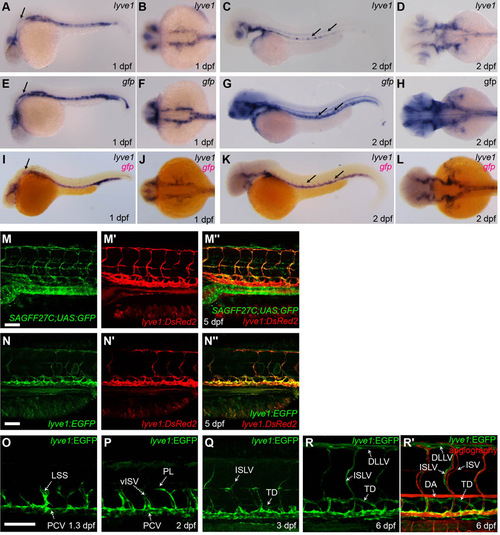
The lyve1 promoter marks regions of endogenous lyve1 expression and labelled trunk lymphatics develop in a pattern known to occur in the emergence of the thoracic duct. (A-L) lyve1 probe (A-D), gfp probe (E-H) and lyve1 (BM Purple) gfp (Fast Red) probes (I-L) applied to lyve1:EGFP embryos at 1 dpf (A,B,E,F,I,J) and 2 dpf (C,D,G,H,K,L) (A,C,E,G,I,K, lateral view; B,D,F,H,J,L dorsal view of anterior region). Black arrows indicate areas where gfp expression does not match endogenous lyve1 expression. (M-M′′) Lateral image of a lyve1:DsRed2;SAGFF27C;UAS:YFP transgenic at 5 dpf showing SAGFF27C;UAS:YFP expression (M), lyve1:DsRed2 (M′) and overlapping lyve1:DsRed2;SAGFF27C;UAS:YFP expression in the trunk lymphatic vessels (M′′). (N-N′′) Lateral image of a lyve1:EGFP;lyve1:DsRed2 transgenic at 5 dpf showing lyve1:EGFP expression (N), lyve1:DsRed2 (N′) and overlapping lyve1:EGFP;lyve1:DsRed2 expression in the trunk lymphatic vessels and PCV (N′′). (O-Q) Lateral images of the developing trunk lymphatics in the lyve1:EGFP transgenic at 1.3 dpf (O), 2 dpf (P) and 3 dpf (Q). (R,R′) Lateral image of the developed trunk lymphatics in lyve1:EGFP transgenic at 6 dpf (R). Microangiography confirms that these vessels contain no blood-flow (R′). DA, dorsal aorta; DLLV, dorsal longitudinal lymphatic vessel; ISLV, intersegmental lymphatic vessel; ISV, intersegmental vessel; LSS, lymphatic secondary sprout; PCV, posterior cardinal vein; PL, parachordal lymphangioblasts; TD, thoracic duct; vISV, venous intersegmental vessel. Scale bar: 100 μm. |
Atlas of lymphatic development in zebrafish from 2 dpf to 15 dpf. (A-H′) Montage of maximum projections of iz series stacks of the entire lyve1:DsRed2;kdrl:EGFP and lyve1:EGFP;kdrl:RFP transgenics (lateral views) at 2-7 dpf (A-F), 12 dpf (G) and 15 dpf (H), and their corresponding ventral images of the head and the anterior intestine (A′-H′). DLLV, dorsal longitudinal lymphatic vessel; ICLV, intercostal lymphatic vessel; ISLV, intersegmental lymphatic vessel; FLS, facial lymphatic sprout; LAA1, first lymphatic branchial arch; LAA2, second lymphatic branchial arch; LAA3, third lymphatic branchial arch; LAA4, fourth lymphatic branchial arch; LFL, lateral facial lymphatic; LL-IL, lower-left intestinal lymphatic; LR-IL, lower-right intestinal lymphatic; L-SIL, left supraintestinal vessel; PHS, primary head sinus; PLV, parachordal lymphatic vessel; MFL, medial facial lymphatic; OLV, otolithic lymphatic vessel; TD, thoracic duct; UL-IL, upper-left intestinal lymphatic; UR-IL, upper-right intestinal lymphatic. Scale bars: 300 μm. |
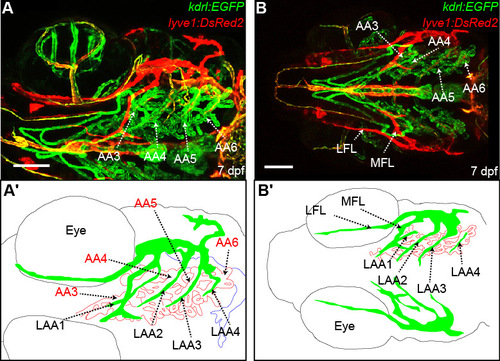
The lymphatic branchial arches develop along the arterial branchial arches. (A,A′) Ventrolateral images of vessels of the pharyngeal area in the lyve1:DsRed2;kdrl:EGFP transgenic at 7 dpf (A), with schematic diagram of arteries (red), veins (blue) and lymphatics (green) (A′). (B,B′) Ventral image of head vessels in the lyve1:DsRed2;kdrl:EGFP transgenic at 7 dpf (B), with schematic diagram (B′). A and B are montage images of two z series stacks. AA3, first branchial arch; AA4, second branchial arch; AA5, third branchial arch; AA6, fourth branchial arch; LAA1, first lymphatic branchial arch; LAA2, second lymphatic branchial arch; LAA3, third lymphatic branchial arch; LAA4, fourth lymphatic branchial arch; LFL, lateral facial lymphatic; MFL, medial facial lymphatic. Scale bars: 100 μm. |
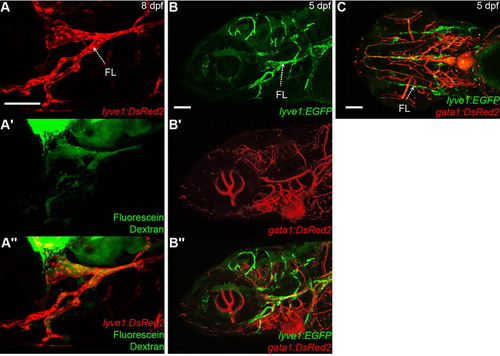
Functional characterisation of the facial lymphatics. (A-A′′) Lateral images of the lyve1:DsRed2 transgenic at 8 dpf showing the FL (A), its dye uptake a few minutes after subcutaneous injection of high molecular weight fluorescein dextran (n=10) (A′), and the merged image of A and A′ (A′′). (B-B′′) Lateral images of lyve1 (B), gata1 (B′) and merged (B′′) expression of the lyve1:EGFP:gata1:DsRed transgenic at 5 dpf showing no blood flow in the FL. (C) The lack of blood flow is more clear in ventral confocal image of the lyve1:EGFP:gata1:DsRed transgenic at 5 dpf. (B-C) Montage images of two z series stacks. FL, facial lymphatics. Scale bars: 100 μm. |
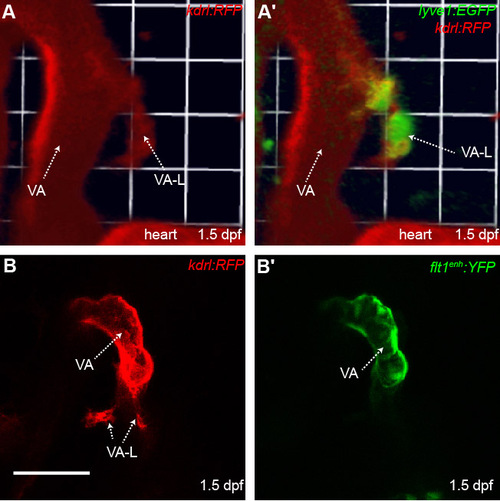
The ventral aorta lymphangioblast is derived from a non-arterial vessel near the ventral aorta. (A,A′) 3D reconstruction of the region where VA-L originates in the lyve1:EGFP;kdrl:RFP transgenic at 1.5 dpf. The VA-L co-expresses kdrl indicating its vascular origins. (B,B′) Ventrolateral images of the kdrl:RFP;flt1enh:YFP transgenic at 1.5dpf. The VA-L does not have flt1enh:YFP expression (B′) indicating its non-arterial origin (n=13). VA, ventral aorta; VA-L, ventral aorta lymphangioblast. Scale bars: 50 μm. |
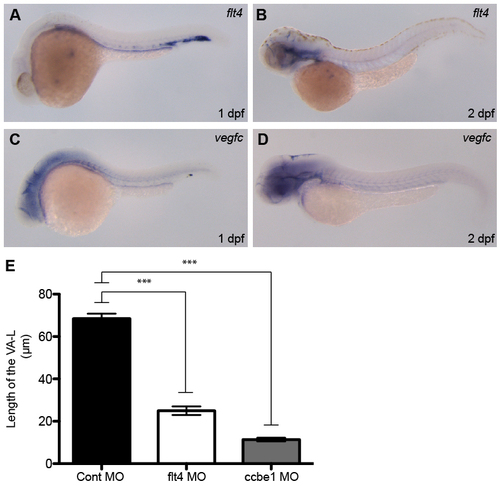
Ventral aorta lymphangioblast migration requires flt4 and ccbe1. (A-D) flt4 probe (A,B) and vegfc probe (C,D) applied to embryos at 1 dpf (A,C) and 2 dpf (B,D) showing flt4 and vegfc expression in the head at 2 dpf (D). (E) Quantification of the length of the VA-L in control (n=22), flt4 (n=32) and ccbe1 (n=26) morpholino-injected embryos at 2 dpf. Error bar represents 95% confidence interval. ***P<0.001. VA-L, ventral aorta lymphangioblast. |