
- Title
-
The polarity protein Pard3 is required for centrosome positioning during neurulation
- Authors
- Hong, E., Jayachandran, P., and Brewster, R.
- Source
- Full text @ Dev. Biol.
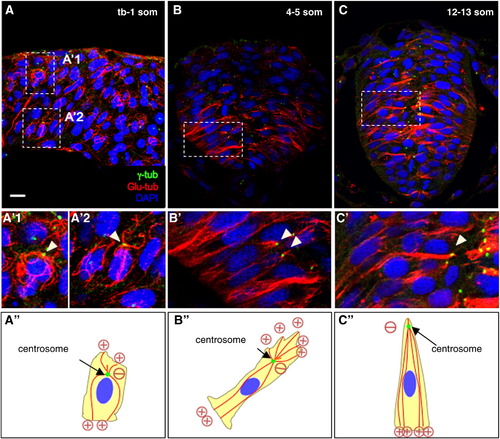
Microtubule organization during neurulation. (A–C) Sections of embryos at the neural plate (A, A′), neural keel (B, B′) and neural rod (C, C′) stages immunolabeled with anti-γ-tub and anti-Glu-tub. (A′–C′) Higher magnification of boxed areas in (A–C). Panels A, A′1, A′2 are a compilation of Z-stacks. (A″–C″) Representations of MT organization. Plus and minus signs indicate the orientation of MT (inferred from the position of the centrosome). The red lines are MT, the green dots are centrosomes. Arrowheads: centrosomes. Scale bars: 10 μm (A–C) and 5 μm (A′–C′). |
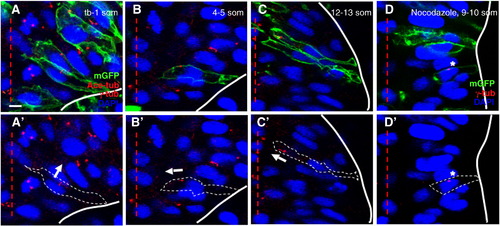
Centrosome position during neural convergence is microtubule-dependent. Sections of WT (A–C) and nocodazole-treated (D) embryos at the neural plate (A, A′), neural keel (B, B′) and neural rod (C, C′, D, D′) stages immunolabeled with anti-Ace-tub, anti-γ-tub and anti-GFP (A–C) or anti-γ-tub and anti-GFP (D). (A′, B′, C′, D′) Same panels as in (A, B, C, D) without the mGFP label. Red lines: midline; white lines: outline of the cells; arrows: orientation of axonemes; asterisk: ectopic centrosome. Scale bar: 5 μm. |
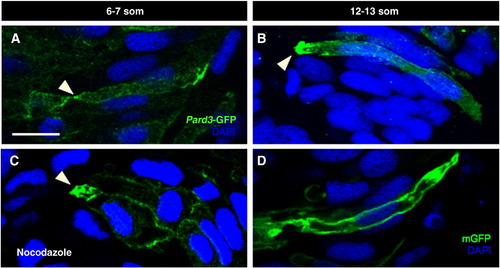
Localization of Pard3-GFP may be microtubule-independent. Sections of control (A, B, D) and nocodazole-treated (C) embryos at 6–7 som (A, C) and 12–13 som (B, D). (A–C) Embryos were mosaically injected at the 8–16 cell stage with pard3-GFP mRNA and immunolabeled with anti-GFP. (C) The nocodazole treatment was performed for 30 min at an early 6 som stage and the embryo was fixed immediately following treatment. (D) Embryo was injected with mGFP DNA and immunolabeled with anti-GFP. Arrowheads: apical localization of Pard3-GFP. Scale bar: 10 μm. |
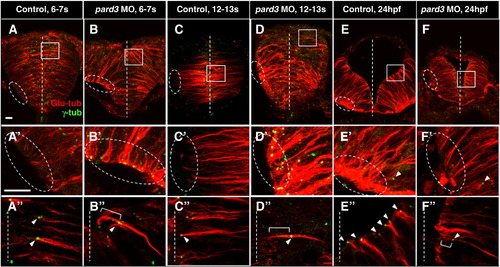
Pard3 is required for apical localization of the centrosome. Sections of control (A–A″, C–C″, E–E″) and pard3 MO-injected (B–B″, D–D″, F–F″) embryos at the early rod (6–7 som, A–B″), late rod (12–13 som, C–D″) and neural tube (24 hpf, E–F″) stages immunolabeled with anti-Glu and anti-γ-tub. Ovals and rectangles in (A–F): areas magnified in panels A′–F′ and A″–F″ respectively; white lines: midline; bracketed lines: MTs extending towards the apical cortex; arrowheads: centrosomes. Scale bar: 10 μm. PHENOTYPE:
|
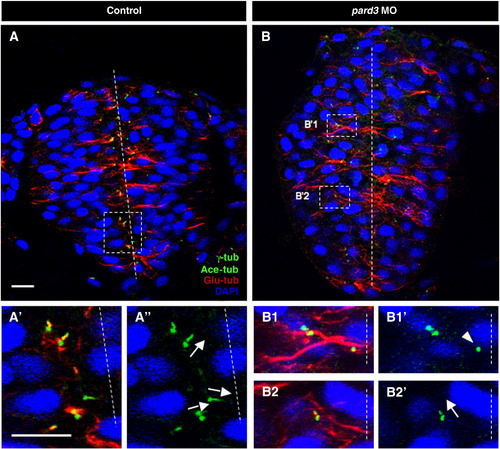
pard3 depletion causes misorientation and delayed cilia growth. Sections of control (A–A″) and pard3 MO-injected (B–B2′) embryos at 12–13 som, immunolabeled with anti-Glu-tub, anti-γ-tub and anti-Ace-tub. Nuclei are labeled with DAPI. (A′, A″, B1–B2′) Higher magnifications of boxed areas in (A) and (B) respectively. Dashed lines: midline; arrows: orientation of cilia; arrowhead: centrosome not associated with an axoneme. Scale bar: 10 μm. PHENOTYPE:
|
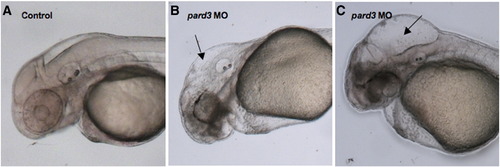
Pard3 depletion causes hydrocephalus. (A–C) Lateral views of 48 hpf control (A) and pard3 MO-injected embryos, with a mild (B) and severe (C) hydrocephalus, imaged using Nomarski optics. Black arrows: enlarged hindbrain ventricles. PHENOTYPE:
|
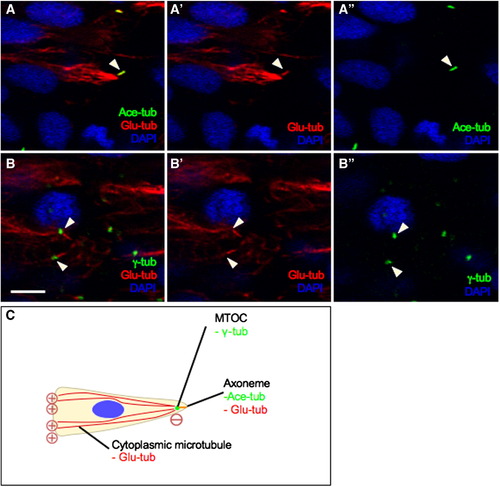
The centriole templates early ciliary axoneme assembly. High magnifications views of cross sections through the hindbrain region of embryos at the neural keel stage, immunolabeled with (A–A″) anti-Ace-tub (ciliary axoneme, in green) and anti-Glu-tub (cytoplasmic MT and ciliary axoneme, in red) or with (B–B″) anti-γ-tub (centrosome, in green) and anti-Glu-tub. Nuclei are labeled with DAPI, in blue. (C) Illustration of cellular organelles visualized using different antibodies. Symbols: arrowheads indicate axonemes; arrows show the centrosome. Scale bar: 5 μm. |
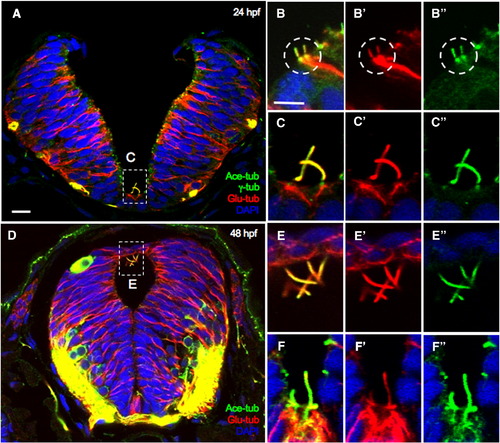
The centrosome/MT/cilium complex is maintained in the neural tube. Cross Sections through the hindbrain region of 24 hpf (A–C″) and 48 hpf (D–F″) embryos immunolabeled with anti-Glu-tub, anti-Ace-tub and anti-γ-tub (A–C″) or with anti-Glu-tub and anti-Ace-tub (D–F″). Nuclei are labeled with DAPI. Symbols: white boxes in A and D: region that is magnified in (C–C″, E–E″), white circle in B–B″: a centrosome/cilia/MT complex. Scale bars: 10 μm in A and 5 μm in B and E. |
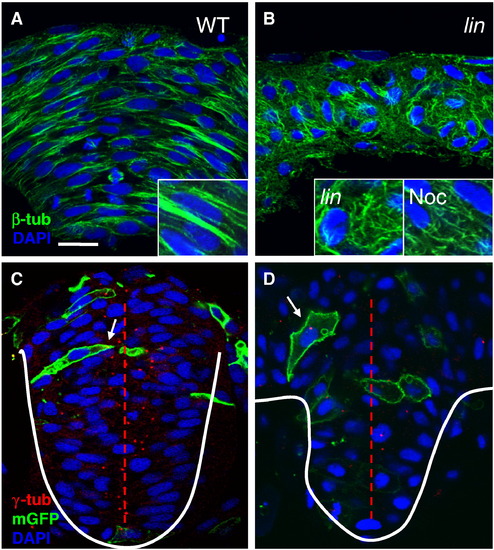
MT organization and centrosome positioning are abnormal in lin mutants. Cross sections through the hindbrain region of WT (A,C), lin mutant (B, D) and nocodazole (noc)-treated (B, inset) embryos at 4–5 som, immunolabeled with anti-β-tub (A, B) and anti-γ-tub and anti-GFP (C,D). Nuclei are labeled with DAPI. Enlarged views of anti-β-tub labeling. White arrows point toward centrosomes in (C) and (D). Red dotted line depicts the midline. Scale bar: 10 μm. PHENOTYPE:
|
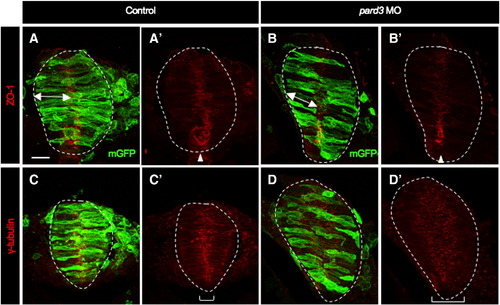
Apico-basal polarity appears normal in pard3 MO-injected embryos. Cross sections through the hindbrain region of mGFP-injected control (A,A′,C,C′) and mGFP, pard3 MO co-injected (B,B′,D,D′) embryos at 12–13 som. Sections from the same embryos were immunolabeled using either anti-ZO-1 (A,A′,B,B′) or anti-γ-tubulin (C,C′,D,D′). White dotted line delineates the neural rod. Double arrowheads indicate length of cell. Brackets show the distribution of γ-tubulin throughout the neuroepithelium. Scale bar: 20 μm. |
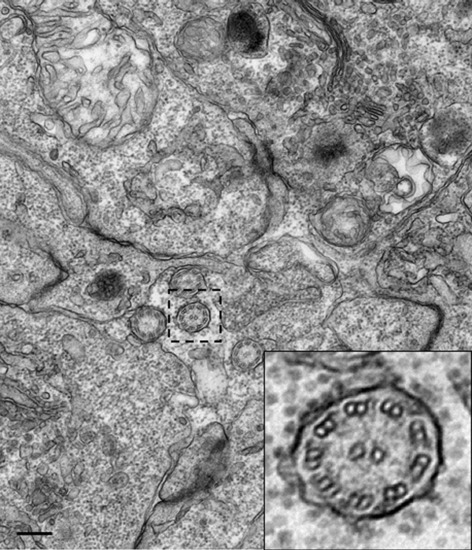
Cilia structure in the neural tube. Transmission electron microscopy image of cilia in the central canal of a 24 hpf embryo, showing a 9 + 2 structure. Boxed area indicates region magnified in inset. Scale bar: 25 nm. |
Reprinted from Developmental Biology, 341(2), Hong, E., Jayachandran, P., and Brewster, R., The polarity protein Pard3 is required for centrosome positioning during neurulation, 335-345, Copyright (2010) with permission from Elsevier. Full text @ Dev. Biol.