
- Title
-
Inhibition of protocadherin-alpha function results in neuronal death in the developing zebrafish
- Authors
- Emond, M.R., and Jontes, J.D.
- Source
- Full text @ Dev. Biol.
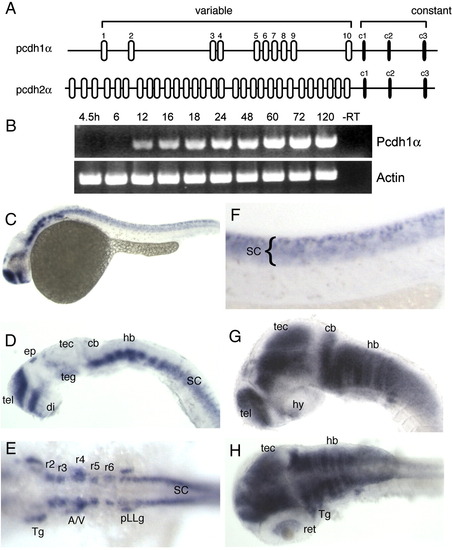
Pcdh1α is expressed in the early zebrafish nervous system. (A) Genomic organization of the two pcdhα genes. Most of this study is concerned with the pcdh1α gene. (B) RT-PCR with primers directed against the common cytoplasmic domain reveals the time-course of pcdh1α expression during development. Onset of expression occurs at ∼ 12 hpf, increases steadily for the first 3 days, then remains highly expressed. (C) Shown here is a 24 hpf embryo labeled with riboprobe against the constant cytoplasmic domain of the pcdh1α gene. Expression is confined to the developing nervous system. (D) Shown here is a lateral view of a brain dissected from a 24 hpf embryo. In the forebrain, expression is present in both the telencephalon and diencephalon. Expression is also found in the ventral midbrain, and in segmental clusters of cells in the hindbrain. In addition, pcdh1α is expressed in ephiphysial neurons. (E) In a dorsal view of the hindbrain, rhombomeric expression is revealed by ladder-like clusters of neurons. In addition, peripheral neurons also exhibit expression, including the trigeminal ganglion neurons, acoustico-vestibular neurons and neurons of the posterior lateral line ganglion. (F) Riboprobe against pcdh1α labels neurons throughout the developing spinal cord. (G and H) By 48 hpf, pcdh1α expression has expanded and has become very strong throughout the developing brain, including the tectum and cerebellum. In addition, staining can be seen in the retina. A/V, acoustico-vestibular; cb, cerebellum; di, diencephalon; ep, epiphysis; hb, hindbrain; hy, hypothalamus; pLLg, posterior lateral line ganglion; r2-r6, rhomobomeres 2–6; ret, retina; SC, spinal cord; tec, tectum; teg, tegmentum; tel, telencephalon; Tg, trigeminal ganglion. |
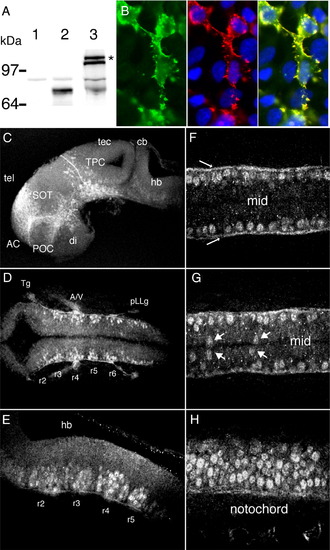
Whole-mount immunocytochemistry of Pcdh1α. (A) A rabbit polyclonal antibody was raised against the constant intracellular domain of Pcdh1α protein. To test the antibody specificity, we expressed a membrane-associated Pcdh1αCD-GFP in HEK293 cells. Cellular extracts from untransfected cells (lane 1) and transfected cells (lane 2) were prepared for SDS-PAGE and probed with the affinity-purified Pcdh1αCD antibody. No immunoreactivity was detected in untransfected cells, but a strong band of the predicted mass (∼ 76 kDa) was detected in transfected cells. We also prepared protein extracts from 72 hpf embryos (lane 3) and detected a doublet of ∼ 105 kDa (asterisk), which are the masses predicted for pcdh1α isoforms. (B) HEK293 cells were transfected with the membrane-targeted Pcdh1αCD-GFP, fixed, and stained using the Pcdh1αCD antibody. Immunolabeling with Pcdh1αCD antibody (red) overlaps strongly with Pcdh1α-GFP (green) in transfected cells, but does not label untransfected cells. DAPI is shown in blue. (C-H) Immunolabeling with Pcdh1αCD antibody is consistent with the in situ hybridization data, as the antibody labels developing neuronal clusters and the early axonal scaffold (C and D). Distinct clusters of neurons can be visualized in the hindbrain (D and E), as can neurons of peripheral ganglia (E). In the spinal cord, axons can be observed in the tracts of the marginal zone (arrows in panel F), in addition to the lateral columns of neurons. In the ventral spinal cord (G), cells are frequently observed close to the midline (arrows), and often appear in pairs, suggesting that Pcdh1α expression turns on upon differentiation, shortly after the terminal cell division. (H) Lateral view of the spinal cord at 28 hpf. A consistent feature of neurons (E–H) is labeling throughout the cell body, demonstrating that Pcdh1αCD is not excluded from the nucleus. Panels C–E are maximum intensity projections of image stacks, and panels F–H are single optical sections. AC, anterior commissure; A/V, acoustico-vestibular; cb, cerebellum; di, diencephalon; ep, epiphysis; hb, hindbrain; hy, hypothalamus; pLLg, posterior lateral line ganglion; POC, postoptic commissure; r2–r6, rhomobomeres 2–6; ret, retina; SC, spinal cord; SOT, supraoptic tract; tec, tectum; teg, tegmentum; tel, telencephalon; Tg, trigeminal ganglion; TPC, tract of the posterior commissure. EXPRESSION / LABELING:
|
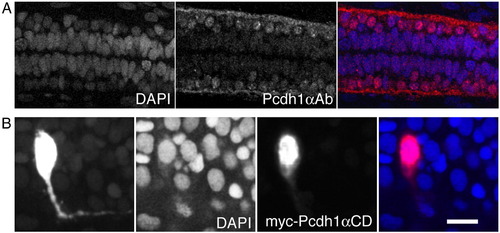
Pcdh1α intracellular domain is present in the nucleus. (A) Shown are dorsal views of the spinal cord from 24 hpf embryos; images are maximum intensity projections of two adjacent optical sections (1 μm spacing). The left panel shows DAPI labeling of cells. The middle panel shows the same field stained with antibody against Pcdh1αCD. The right panel is an overlay showing that Pcdh1α immunoreactivity is present in neuronal nuclei. (B) The leftmost panel is a maximum intensity projection of a spinal interneuron that has been labeled with a myc-tagged Pcdh1αCD. The myc-Pcdh1αCD fusion is distributed throughout the neuron. The middle two panels show single optical sections through the same neuron. The center-left panel shows staining of nuclei with DAPI and the center-right panel shows anti-myc immunolabeling. The myc-Pcdh1αCD is enriched in the nucleus. The overlay of the two fluorescence images is shown in the panel on the right. Scale bar = 10 μm. EXPRESSION / LABELING:
|
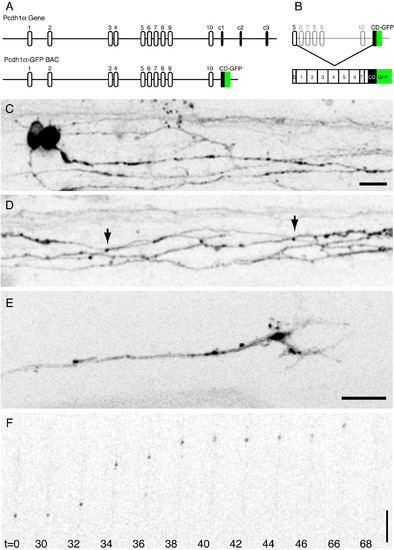
Pcdh1α-GFP expression by BAC recombineering. (A) The organization of the pcdh1α gene in the original (top) and recombineered (bottom) BACs. (B) Each variable exon consists of a signal sequence (S), 6 cadherin repeats, a transmembrane segment (T) and a very short portion of the cytoplasmic domain (CD). Each of these is spliced to the Pcdh1αCD-GFP to generate GFP-tagged proteins that are full length protocadherins. (C) Neurons labeled in the spinal cord of a ∼ 28 hpf embryo. Pcdh1α-GFP exhibits both nuclear and perinuclear staining and strongly labels axons. Scale bar = 10 μm. (D) Axonal labeling is largely diffuse and continuous, although small puncta are occasionally present (arrows). (E) Pcdh1α-GFP is enriched in the central core of axonal growth cones, and is likely concentrated in intracellular organelles. Scale bar = 8 μm. (F) Mobile transport organelles can be visualized using time-lapse microscopy. These transport packets have similar properties to transport packets previously observed both in vitro and in vivo. Scale bar = 10 μm. |
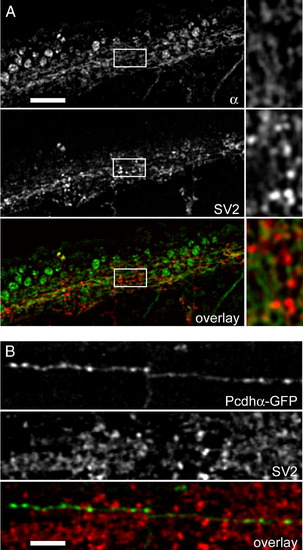
Pcdh1α does not colocalize with presynaptic markers. (A) Maximum intensity projections of 3 adjacent optical sections (spacing is 1 μm) were generated in order to reconstruct an extended region of labeled axon tracts in the spinal cord of a 24 hpf embryo. The top panel shows labeling with antibody against Pcdhα; the middle panel shows staining with the presynaptic marker, SV2; the bottom panel shows the overlay. The panels on the right are magnified views of the boxed regions. Although both SV2 and Pcdh1α antibodies label many of the same axons, the staining patterns are distinct with Pcdhα failing to exhibit punctate staining that overlaps with SV2. Scale bar = 25 μm. (B) Shown are maximum intensity projections of 2 adjacent optical sections (spacing is 0.5 μm). The top panel shows a segment of axon labeled with Pcdhα-GFP, which was then processed for whole-mount immunocytochemistry. In general, the labeling of Pcdhα-GFP in fixed tissue appears more discontinuous than in living embryos. The middle panel shows the same field, which has been labeled with SV2 antibodies. Although the discontinuity of Pcdhα-GFP labeling has an almost punctate appearance, it does not significantly overlap, or co-vary, with the punctate SV2 labeling. Scale bar = 8 μm. EXPRESSION / LABELING:
|
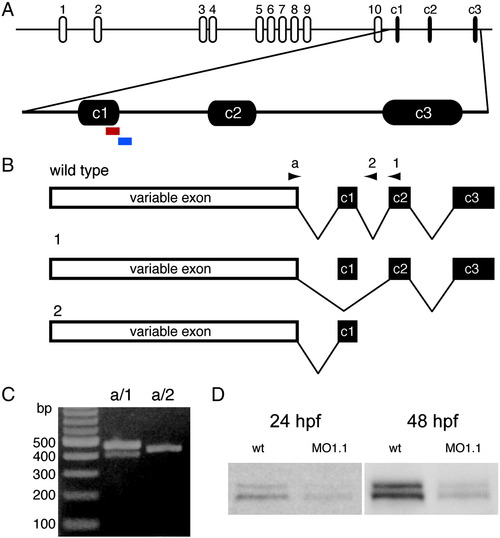
Antisense morpholinos block splicing of pcdh1α. (A) Schematic diagram showing the strategy for disrupting pcdh1α, using splice-blocking morpholinos. The red and blue bars show the relative positions of MO1.1 and MO1.2, respectively. (B) Schematic describing the predicted outcomes of our pcdh1α splice-blocking strategy. The labeled arrows indicate the positions of our diagnostic PCR primers. (C) RT-PCR using RNA from morpholino injected embryos. Lane a/1 shows two bands, the upper is representative of wildtype mRNA, in which splicing has occurred properly. The lower band reflects the deletion of constant exon 1, in which the pcdh1α variable exons have been spliced directly to constant exon 2. Constant exon 2 and the variable exons are in different reading frames, resulting in a stop codon shortly after the end of the variable exons (variant 1 in panel B). Lane a/2 shows a band that results from the inclusion of the C1/C2 intron. This product is also truncated, with a stop codon occurring shortly after the end of constant exon 1 (variant 2 in panel B). In this experiment, aberrantly spliced variants account for > 60% of the detected transcripts. (D) To assess the degree of protein loss in response to morpholino injections, we performed Western blots at 24 and 48 hpf. The levels of both bands of the doublet are decreased in response to MO1.1 morpholino injection. At 24 hpf, the levels of Pcdhα were reduced to ∼ 26% of wild type levels, while at 48 hpf, the levels were reduced to ~18%. |
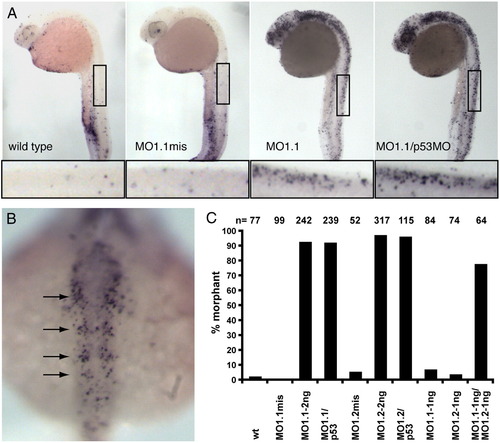
Pcdh1α splice-blocking morpholinos result in apoptosis throughout the CNS. (A) Shown here are 24 hpf embryos processed for TUNEL to assess levels of apoptosis. Wild type and 5 basepair mismatch control morpholinos exhibited relatively little cell death at 24 hpf, as indicated by the lack of darkly stained nuclei. In contrast, pcdh1α-morpholino-injected embryos (2.5 ng) showed a dramatic increase in labeled nuclei, which was not prevented by co-injection of 5 ng p53MO. Thus, the reduction in full-length Pcdh1α protein results in neuronal death. The insets show magnified views of the boxed portion of the spinal cord. (B) Dorsal view of the hindbrain region in a pcdh1α-morpholino-injected embryo at 24 hpf. Bilateral clusters of apoptotic cells can be observed that exhibit a rhombomeric pattern (arrows) that mimics the expression pattern determined by in situ hybridization and immunocytochemistry. (C) Acridine orange staining was performed to score embryos for the cell death phenotype. We designed two different morpholinos against pcdh1α (MO1.1 and MO1.2), as well as 5 bp mismatch controls for each (MO1.1mis and MO1.2mis). Injection of 2.5 ng of either splice-blocking morpholino yielded extensive cell death in > 90% of injected embryos. Injection of control morpholinos failed to cause cell death. Co-injection of 5 ng of a p53 morpholino with 2.5 ng of either splice-blocking morpholino failed to inhibit apoptosis, demonstrating that the cell death is not due to off-target activation of the p53 pathway. Injection of 1 ng of either MO1.1 or MO1.2 failed to cause a significant increase in apoptosis, while a combined dose of 1 ng of each morpholino resulted in a large increase in cell death. PHENOTYPE:
|
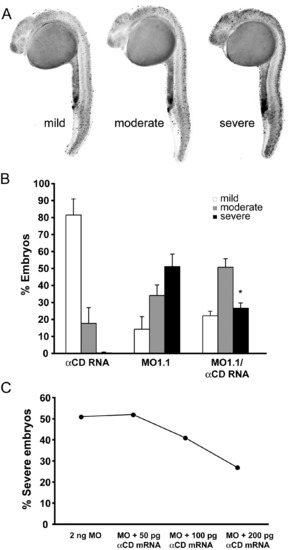
Expression of Pcdh1α-cytoplasmic domain attenuates neuronal apoptosis. (A) Morpholino-injected embryos exhibit a range of phenotypes that we have grouped into wild type/mild, moderate and severe, on the basis of density of apoptotic cells and embryo morphology. Shown are representative embryos for each group. (B) To assess the ability of the Pcdh1α cytoplasmic domain to attenuate the apoptosis observed in response to Pcdh1α disruption, we injected either Pcdh1αCD mRNA (200 pg), MO1.1 (2.5 ng), or both together. By itself, Pcdh1αCD mRNA resulted in a small increase in the number of embryos exhibiting moderate levels of apoptosis (n = 190). Injection of MO1.1 resulted in an increase in embryos exhibiting both moderate and severe levels of cell death (34% ± 6 moderate, 51% ± 7 severe; mean ± SEM; n = 214). When MO1.1 and Pcdh1αCD mRNA are co-injected, the percentage of embryos exhibiting a severe phenotype is dramatically decreased (51% ± 5 moderate, 27% ± 3 severe; mean ± SEM; n = 195; p < 0.05, Student's t-test), indicating a shift toward milder phenotypes. Thus, expression of the Pcdh1α cytoplasmic domain can attenuate the effects of morpholino injection. (C) In order to demonstrate the specificity of the myc-αCD mRNA effects, we determined the dose-dependence of the observed attenuation of cell death. Embryos were injected with 2 ng of MO1.1 along with 0, 50, 100 or 200 pg of myc-αCD mRNA. We found that 50 pg of mRNA had no discernible effect on the severity of cell death, but that 100 pg and 200 pg were increasingly effective in reducing the percentage of embryos exhibiting a severe phenotype (0 pg mRNA: 51%, n = 42; 50 pg: 52%, n = 52; 100 pg: 41%, n = 69; 200 pg: 27%, n = 195). PHENOTYPE:
|
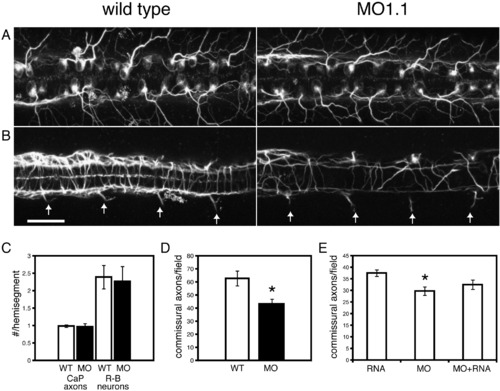
Pcdh1α splice-blocking morpholinos result in loss of neuronal subsets. (A) Immunolabeling of either wild type or pcdh1α-morpholino-injected embryos with a monoclonal antibody against acetylated tubulin prominently labeled neuronal cell bodies and axons, including Rohon–Beard cells, which are large sensory neurons present in the dorsal spinal cord. These cells extend elaborate sensory arbors, which innvervate the skin. Maximum intensity projections from optical sections of the dorsal spinal cord revealed the bilateral arrays of Rohon–Beard cells and a portion of their sensory arbors. Pcdh1α-morpholino-injection did not lead to any significant loss of Rohon–Beard cells, nor did it affect arborization of their sensory axons (C). (B) Maximum intensity projections of the ventral spinal cord revealed longitudinal axon tracts, as well as commissural axons. In addition, this view revealed the exit of CaP motor axons from the spinal cord at the ventral roots. In contrast to wild type embryos, pcdh1α-morpholino-injected embryos exhibited a loss of both longitudinal axons and commissural axons. However, there was no difference in the number of CaP motor axons. (C) As is apparent in (a) and b), there was no difference in either the number of CaP motoneurons or Rohon–Beard sensory neurons (32 spinal segments from 8 embryos for each data set). D, There was a substantial loss of commissural axons in pcdh1α-morpholino-injected embryos. Wild type embryos had an average of 62 ± 5.7 (mean ± SEM, n = 8 embryos) commissural axons within 4 spinal segments at 26 hpf. In a matched set of embryos injected with MO1.1, there were 42 ± 4.6 (mean ± SEM, n = 8 embryos) commissural axons per 4 spinal segments. This difference was found to be statistically significant (p < 0.05, Student's t-test). (E) Expression of the soluble Pcdhα cytoplasmic domain partially attenuates the loss of commissural axons. Embryos were injected with PcdhαCD mRNA alone, MO1.1 alone or MO1.1 and PcdhαCD mRNA were immunolabeled for acetylated-tubulin at 23 hpf. The mRNA-injected embryos had an average of 37.5 ± 1.4 (mean ± SEM, n = 8 embryos) labeled commissural axons per 4 spinal segments. Morpholino-injected embryos had an average of 29.75 ± 1.8 (mean ± SEM, n = 8 embryos) axons. This difference was statistically significant (p < 0.01, Student's t-test). Embryos injected both with mRNA and MO1.1 exhibited an intermediate number of labeled axons, 32.5 ± 2 (mean ± SEM, n = 8 embryos). |
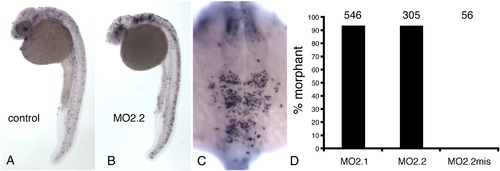
Antisense morpholino knockdown of pcdh2α results in neuronal cell death. A, TUNEL staining of a 24 hpf embryo injected with a 5 basepair mismatch morpholino showed low levels of cell death. B, A 24 hpf embryo injected with 4 ng of a splice-blocking morpholino directed against the pcdh2α constant exons resulted in a dramatic increase in cell death throughout the nervous system, similar to what was observed for the pcdh1α cluster. C, A dorsal view of the hindbrain of a 30 hpf embryo showed extensive cell death in the hindbrain. D, Injection of 4 ng of either MO2.1 (n = 546) or MO2.2 (n = 305) yielded the cell death phenotype in > 90% of embryos. Injection of 4 ng of a 5 basepair mismatch control morpholino did not result in cell death (n = 56). |

Unillustrated author statements |
Reprinted from Developmental Biology, 321(1), Emond, M.R., and Jontes, J.D., Inhibition of protocadherin-alpha function results in neuronal death in the developing zebrafish, 175-187, Copyright (2008) with permission from Elsevier. Full text @ Dev. Biol.