
Fig. 2
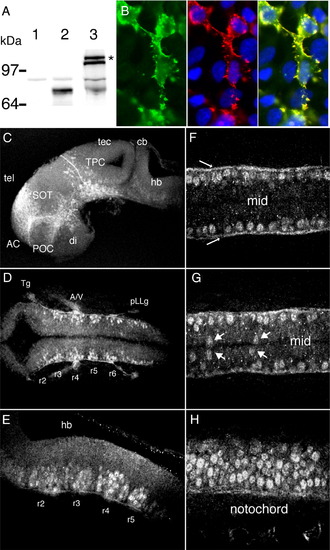
Whole-mount immunocytochemistry of Pcdh1α. (A) A rabbit polyclonal antibody was raised against the constant intracellular domain of Pcdh1α protein. To test the antibody specificity, we expressed a membrane-associated Pcdh1αCD-GFP in HEK293 cells. Cellular extracts from untransfected cells (lane 1) and transfected cells (lane 2) were prepared for SDS-PAGE and probed with the affinity-purified Pcdh1αCD antibody. No immunoreactivity was detected in untransfected cells, but a strong band of the predicted mass (∼ 76 kDa) was detected in transfected cells. We also prepared protein extracts from 72 hpf embryos (lane 3) and detected a doublet of ∼ 105 kDa (asterisk), which are the masses predicted for pcdh1α isoforms. (B) HEK293 cells were transfected with the membrane-targeted Pcdh1αCD-GFP, fixed, and stained using the Pcdh1αCD antibody. Immunolabeling with Pcdh1αCD antibody (red) overlaps strongly with Pcdh1α-GFP (green) in transfected cells, but does not label untransfected cells. DAPI is shown in blue. (C-H) Immunolabeling with Pcdh1αCD antibody is consistent with the in situ hybridization data, as the antibody labels developing neuronal clusters and the early axonal scaffold (C and D). Distinct clusters of neurons can be visualized in the hindbrain (D and E), as can neurons of peripheral ganglia (E). In the spinal cord, axons can be observed in the tracts of the marginal zone (arrows in panel F), in addition to the lateral columns of neurons. In the ventral spinal cord (G), cells are frequently observed close to the midline (arrows), and often appear in pairs, suggesting that Pcdh1α expression turns on upon differentiation, shortly after the terminal cell division. (H) Lateral view of the spinal cord at 28 hpf. A consistent feature of neurons (E–H) is labeling throughout the cell body, demonstrating that Pcdh1αCD is not excluded from the nucleus. Panels C–E are maximum intensity projections of image stacks, and panels F–H are single optical sections. AC, anterior commissure; A/V, acoustico-vestibular; cb, cerebellum; di, diencephalon; ep, epiphysis; hb, hindbrain; hy, hypothalamus; pLLg, posterior lateral line ganglion; POC, postoptic commissure; r2–r6, rhomobomeres 2–6; ret, retina; SC, spinal cord; SOT, supraoptic tract; tec, tectum; teg, tegmentum; tel, telencephalon; Tg, trigeminal ganglion; TPC, tract of the posterior commissure. |
Reprinted from Developmental Biology, 321(1), Emond, M.R., and Jontes, J.D., Inhibition of protocadherin-alpha function results in neuronal death in the developing zebrafish, 175-187, Copyright (2008) with permission from Elsevier. Full text @ Dev. Biol.