- Title
-
Suppression of lens growth by alphaA-crystallin promoter-driven expression of diphtheria toxin results in disruption of retinal cell organization in zebrafish
- Authors
- Kurita, R., Sagara, H., Aoki, Y., Link, B.A., Arai, K.-I., and Watanabe, S.
- Source
- Full text @ Dev. Biol.
|
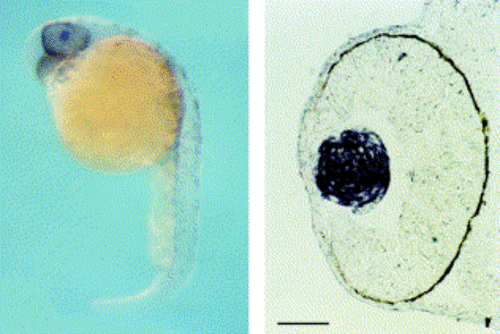
Lens-specific expression of zebrafish αA-crystallin mRNA. Whole-mount in situ of zebrafish embryo (29 hpf) was done by using DIG-labeled fragment of zebrafish αA-crystallin (left panel). Hybridization with control sense probe resulted in no signal (data not shown). In situ hybridization of frozen sectioned zebrafish embryos (right panel). Embryos were fixed by PFA and frozen in OCT. Sections were 10 μM thick, and hybridized with DIG labeled fragments. Scale, 50 μM. EXPRESSION / LABELING:
|
|
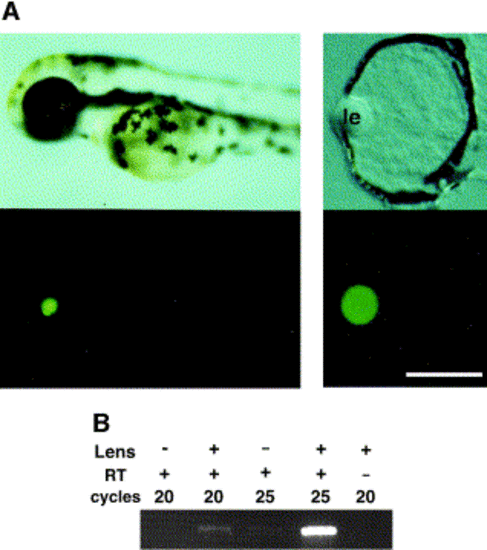
Zebrafish αA-crystallin promoter expressed EGFP lens-specific manner. (A) zαAcry-EGFP plasmid was injected into zebrafish eggs at the one- or two-cell stage, and lateral viewes under a dissection microscope are shown (left panel). An upper panel shows a view of a live embryo at 54 hpf, and a lower panel shows EGFP fluorescence image. Central transverse frozen sections were examined, and Normarsky image (right upper panel) and EGFP fluorescence (right lower panel) are shown. “le” indicates lens. Scale, 50 μM. (B) RT-PCR pattern of EGFP. EGFP-expressing embryos were collected and divided into two groups. For one group, the lenses were surgically removed; and for the other group, they were kept intact. Embryos were then decapitated, their heads were collected (more than 70 embryos for each group), and mRNA was prepared. RT-PCR of EGFP was done and visualized by agarose gel electrophoresis. (C) Alignment of the proximal 5′ region of zebrafish, chick, and mouse αA-crystallin gene. Conserved nucleotides were hatched, and cis-elements reported in chick (under the sequence) and mouse (above the sequence) are indicated (Cvekl and Piatigorsky 1996 and Ilagan et al 1999). (D) Summary of results of a series of deletion mutants from the 5′ side of zebrafish αA-crystallin. A series of deletion mutants of αA-crystallin promoter-EGFP was injected fertilized eggs at the one- or two-cell stage. The microinjected embryos were examined under a fluorescence dissection microscope. Square and circle indicate highly conserved regions. With chick and mouse promoters, it was reported that transcription factor binding sites were clustered in these region. |
|
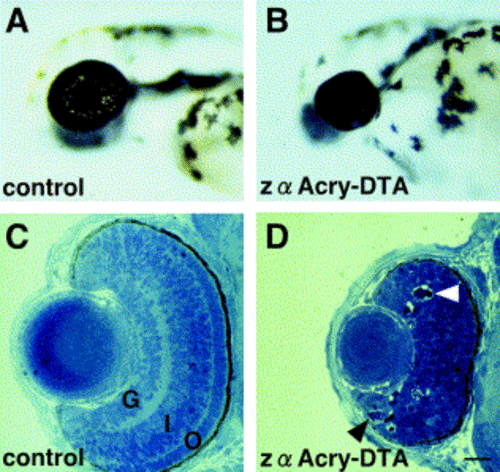
Morphological characterization of the zα Acry-DTA-expressed embryo. Views of live wild-type (A) and DTA-expressing (B) embryos at 54 hpf. Toluidine blue-stained sections through control (C) and DTA-expressing (D) eyes at 54 hpf. The three nuclear cell layers, retinal ganglion layer (G), inner nuclear layer (I), and outer nuclear layer (O), are visible in the wild-type retina. No layers are apparent in DTA-expressing retina, and apoptotic cells are indicated by arrowheads (D). Scale bars, 20 μm. |
|
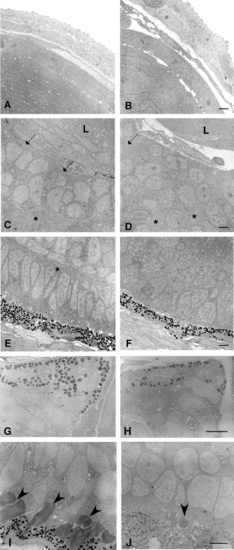
Electron microscopic analysis of the eye of zαAcry-DTA-expressing embryo. Electron micrographs of eyes of control (A, C, E, G, I) and zαAcry-DTA-injected (B, D, F, H, J) zebrafish embryos at 54 hpf (A–F) and 72 hpf (G–J). (A, B) Cornea and lens at 54 hpf. Morphology of the cornea and lens epithelial cells is essentially the same between control (A) and zαAcry-DTA-injected (B) embryos. Many thin lens fiber cells are seen in the control eye (A), and thick cells with a large round nucleus are seen in the zαAcry-DTA-injected (B) embryos. (C, D) Interface between the lens (L) and the retina. Bundles of many cell processes (arrows) are seen in the innermost layer of the control retina at 54 hpf. At the bottom of the photograph (* in C), a continuous layer of cell processes is seen. In the retina of the zαAcry-DTA-injected animals (D), cell processes do not form continuous layers and some are seen within small areas (* in D) between cell nuclei. (E, F) Outermost area of the retina. A layer of regularly arranged columnar nuclei is separated by a layer of cell processes (*) from the inner cell nuclei in the control (E). No regular arrangement of the nuclei can be seen the eye of the zαAcry-DTA-injected embryos (F). Retinal pigment epithelial cells of both the zαAcry-DTA-injected (F) and the control (E) embryo contain pigment granules. (G, H) Tip of the eye cup at 72 hpf. Pigmented cells at the tip of the eye cup expand toward the lens in both control (G) and the zαAcry-DTA-injected (H) embryos. (I, J) Outermost area of the retina at 72 hpf. Photoreceptor outer segments are observed in the control embryos (I). In contrast, outer segment-like structures were seen only occasionally in the zαAcry-DTA-injected embryos (J). Outer segments (I) or outer segment-like structure (J) are indicated by arrowheads. Scale, 2 μM. |
|
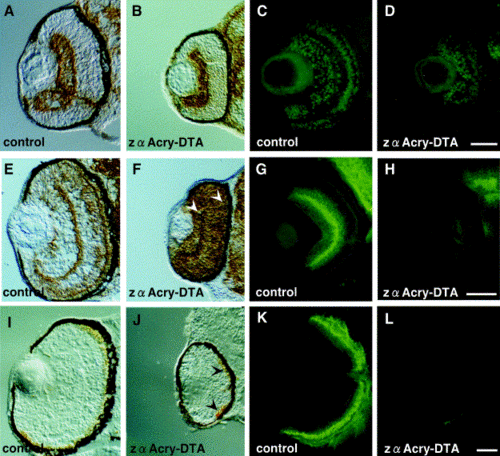
Immunohistochemical analysis of the sectioned zebrafish embryo eye with various retinal differentiation markers. (A, B) Retinal ganglion cells, stained with anti-neurolin (DM-GRASP) antibody (zn-5). (C, D) Retinal ganglion cells, inner nuclear layer, stained with anti-Islet 1. (E, F) Inner nuclear layer and outer plexiform layer, stained with Zns-2. (G, H) Amacrine and horizontal cells, stained with anti-syntaxin antibody. (I, J) Cone cell stained with Zpr-1. (K, L) Rod cells, stained with Zpr-3. Zebrafish eggs were injected with zαA-crystallin-DTA or control plasmid and central, transverse frozen sections were made at 48 (A, B, E, F), 54 (C, D, G, H), 72 (I, J), or 96 (K, L) h after fertilization. Immunohistochemistry was done, and staining was visualized by use of an ABC kit (A, B, E, F, I, J) or alexa 488 (C, D, G, H, K, L). Scale bars, 50 μm. |
|
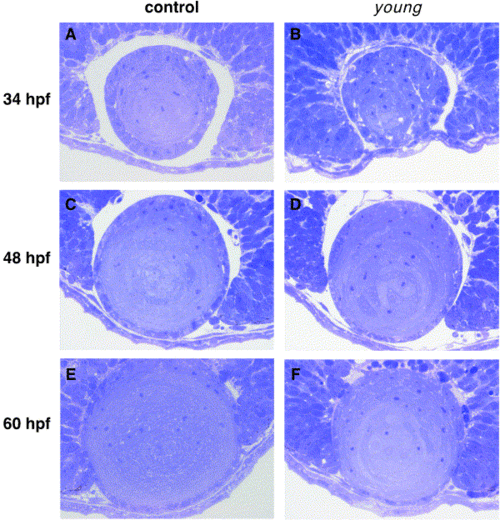
The lens development of young mutant. The morphology of lens of young mutant and controls at 34, 48, and 60 hpf were analyzed under light microscopy. Toluidine blue-stained sections through control (left panels) and young mutant (right panels) eyes at 34 (A, B), 48 (C, D), and 60 (E, F) hpf are shown. |
|
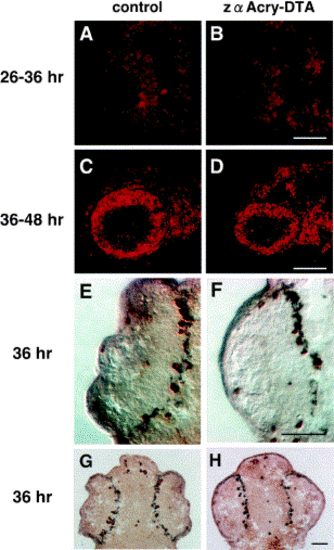
Cell cycle progression of zαAcry-DTA-expressing embryos examined by analyzing the incorporation of BrdU and anti Histone H3 antibody. BrdU was injected into the yolk of control (A, C) and zαAcry-DTA-expressing (B, D) embryos at 26 (A, B) or 36 (C, D) hpf, and the embryos were harvested at 36 (A, B) or 48 (C, D) hpf. Incorporated BrdU was visualized with Cy3-conjugated second antibody, and photos were taken under observation with an Axioplan microscope (Carl Zeiss). Scale bars, 50 μm. M-phase cells are visualized by the staining with anti-phospho Histone H3 antibody (E–H). Frozen sections of control (E, G) or zαAcry-DTA-expressing (F, H) embryos at 36 hpf were immunostained with anti-phospho Histone H3. Signals are visualized by using an ABC kit. (E, G) and (F, H) are different magnified pictures of different samples. Scale bars, 50 μm. |
|
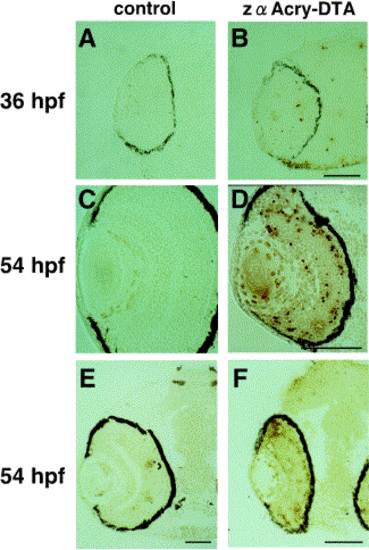
Apoptosis of DTA-expressing embryos. In situ TUNEL analysis was done by using central, transverse frozen sections of zebrafish embryonic eyes. DTA-expressing or control embryos at 36 and 54 hpf were embedded in OCT compound and frozen sectioned. FITC conjugate–dUTP-labeled cells were visualized with anti-FITC-horseradish peroxidase conjugate antibody and DAB. Samples were examined under Normarsky microscopy (Axioplan; Carl Zeiss). Scale bars, 50 μm. |
Reprinted from Developmental Biology, 255(1), Kurita, R., Sagara, H., Aoki, Y., Link, B.A., Arai, K.-I., and Watanabe, S., Suppression of lens growth by alphaA-crystallin promoter-driven expression of diphtheria toxin results in disruption of retinal cell organization in zebrafish, 113-127, Copyright (2003) with permission from Elsevier. Full text @ Dev. Biol.

