
- Title
-
Evaluation of Dexamethasone-Induced Osteoporosis In Vivo Using Zebrafish Scales
- Authors
- Chaichit, S., Sato, T., Yu, H., Tanaka, Y.K., Ogra, Y., Mizoguchi, T., Itoh, M.
- Source
- Full text @ Pharmaceuticals (Basel)
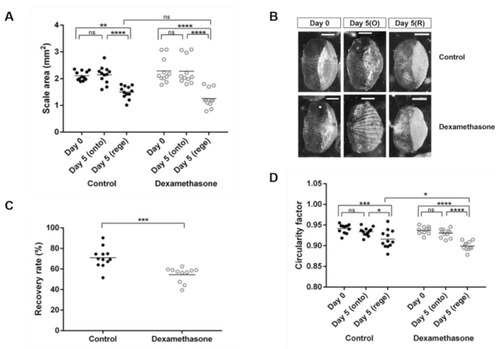
Morphometric analyses of zebrafish scales on day 0, ontogenetic scales on day 5, and regenerated scales on day 5 from the control (black dots) and dexamethasone-treated groups (open dots). Each dot represents an average value of each fish: (A) Scale area (mm2), (B) Representative scales from control and dexamethasone group on day 0 and day 5 (scale bars = 0.5 mm), (C) Percentage of the recovery rate of scale regeneration, (D) Circularity factor (4πA/P2; where A is the surface area and P is the perimeter). Interactions between groups were assessed with two-way ANOVA with Tukey’s multiple comparisons test. Data are shown as the mean ± SEM (**** p ≤ 0.0001; *** p ≤ 0.001; ** p ≤ 0.01; * p ≤ 0.05; ns: not significant). Error bars indicate the standard error of the mean. |
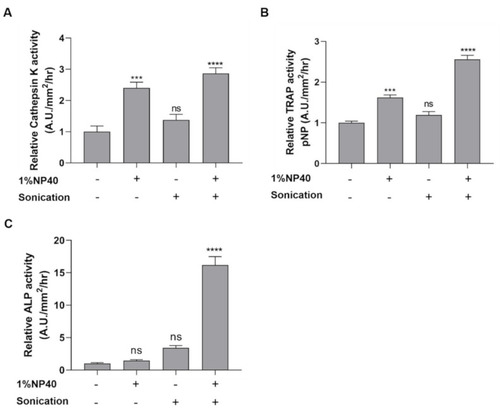
Effect of detergent (1% NP-40) and sonication on enzymatic activities relative to the control. The scale samples lysed in the buffer in the presence (+) or absence (−) of 1%NP40 and sonication. (A) Cathepsin K activity, (B) TRAP activity, and (C) ALP activity. Interactions between groups were assessed with one-way ANOVA. The significant statistical analyses were analyzed with Tukey’s multiple comparison test. Data are shown as the mean ± SEM (**** p ≤ 0.0001; *** p ≤ 0.001; ns: not significant). Error bars indicate the standard error of the mean. |
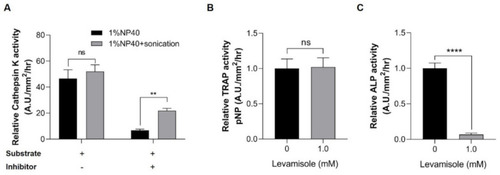
Inhibitor specificity in enzyme assays. (A) Cathepsin K activity. The lysates extracted under 1% NP-40 only (black bar) and 1% NP-40+sonication (gray bar) conditions were used in the cathepsin K assay. The lysates were incubated with a substrate and the presence (+) or absence (−) of cathepsin K inhibitor. The enzymatic activity was calculated as the ratio between the fluorescence values of the lysate and background (relative to 1), (B) TRAP activity, and (C) ALP activity. Lysates extracted under 1% NP-40 and sonication conditions were incubated with an acidic buffer and an alkaline buffer containing pNPP and 1 mM levamisole (an ALP inhibitor) to measure the activities of TRAP and ALP, respectively. These activities were determined using the UV spectroscopy method (λ = 405 nm). Values are presented as the mean ± SEM. Significant differences were calculated by Student’s t-test, with **** p ≤ 0.0001; ** p ≤ 0.01; ns: not significant. Error bars indicate the standard error of the mean. |
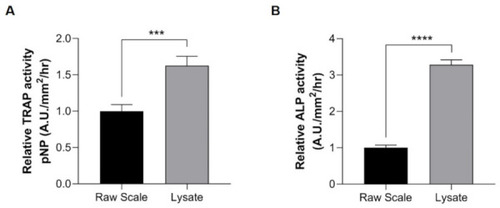
Determination of enzyme activities using raw scales (black bar) and lysate (gray bar). (A) TRAP activity and (B) ALP activity. Lysate samples (gray bar) exhibit high activity levels compared with raw scale samples (black bar). Comparisons between the two groups were performed by Student’s t-test. The comparison of the methods was tested by the unpaired t-test method. Data are shown as the mean ± SEM (**** p ≤ 0.0001; *** p ≤ 0.001). Error bars indicate the standard error of the mean. |
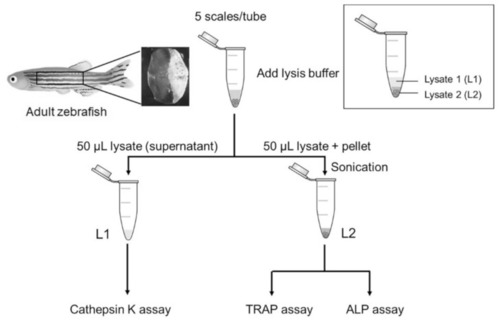
The schematic diagram of the scale lysis method. Five fish scales were pooled in a microcentrifuge tube. When starting an experiment, the scales were incubated in lysis buffer and then centrifuged at 17,400× g. The first half of the lysate (supernatant) was collected for cathepsin K assay. The remaining lysate was sonicated and then used for TRAP and ALP assays. |
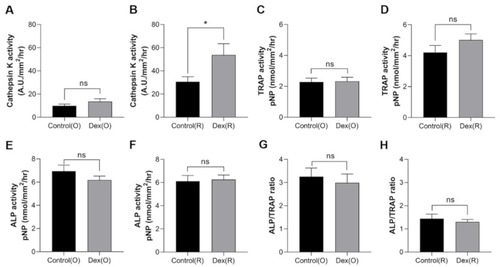
Enzymatic activities of scale lysates from the control (black bar) and dexamethasone-treated groups (gray bar) on day 5 of the experiment. Cathepsin K activity of (A) ontogenetic scales and (B) regenerated scales, TRAP activity of (C) ontogenetic scales and (D) regenerated scales, ALP activity of (E) ontogenetic scales and (F) regenerated scales, and ALP/TRAP ratio of (G) ontogenetic scales and (H) regenerated scales. Comparisons between groups were assessed with Student’s t-test. Data are shown as the mean ± SEM (* p ≤ 0.05; ns: not significant). Error bars indicate the standard error of the mean. |
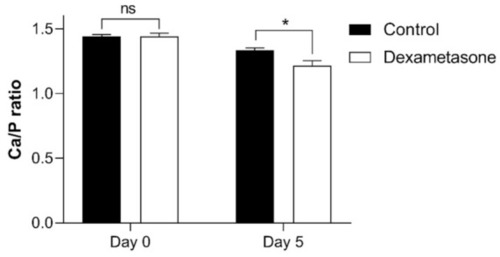
Ca/P ratio of zebrafish scales on day 0 and day 5 of the experiment from the control (black bar) and dexamethasone groups (white bar). Ten scales from each were collected and measured the calcium and phosphorus levels using ICP-MS. Values are presented as the mean ± SEM using Student’s t-test, with * p ≤ 0.05; ns: not significant. Error bars indicate the standard error of the mean. |