
Figure 6
- ID
- ZDB-FIG-210707-102
- Publication
- Chaichit et al., 2021 - Evaluation of Dexamethasone-Induced Osteoporosis In Vivo Using Zebrafish Scales
- Other Figures
- All Figure Page
- Back to All Figure Page
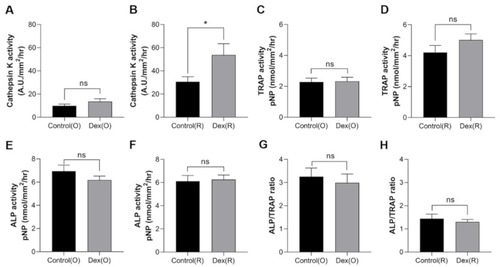
Enzymatic activities of scale lysates from the control (black bar) and dexamethasone-treated groups (gray bar) on day 5 of the experiment. Cathepsin K activity of (A) ontogenetic scales and (B) regenerated scales, TRAP activity of (C) ontogenetic scales and (D) regenerated scales, ALP activity of (E) ontogenetic scales and (F) regenerated scales, and ALP/TRAP ratio of (G) ontogenetic scales and (H) regenerated scales. Comparisons between groups were assessed with Student’s t-test. Data are shown as the mean ± SEM (* p ≤ 0.05; ns: not significant). Error bars indicate the standard error of the mean. |