
Image
|
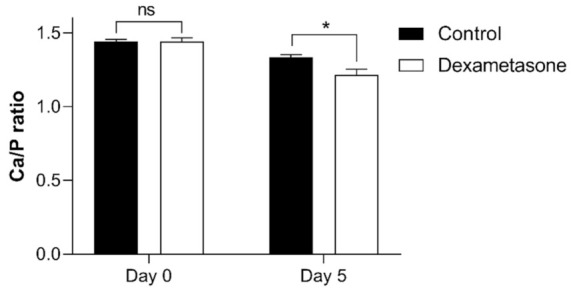
Figure Caption
Figure 7 Ca/P ratio of zebrafish scales on day 0 and day 5 of the experiment from the control (black bar) and dexamethasone groups (white bar). Ten scales from each were collected and measured the calcium and phosphorus levels using ICP-MS. Values are presented as the mean ± SEM using Student’s t-test, with * p ≤ 0.05; ns: not significant. Error bars indicate the standard error of the mean.
Acknowledgments
This image is the copyrighted work of the attributed author or publisher, and
ZFIN has permission only to display this image to its users.
Additional permissions should be obtained from the applicable author or publisher of the image.
Full text @ Pharmaceuticals (Basel)