
Image
|
Figure Caption
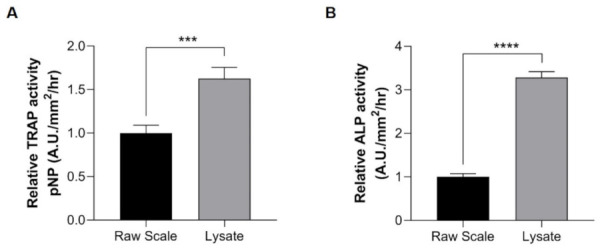
Figure 4 Determination of enzyme activities using raw scales (black bar) and lysate (gray bar). (A) TRAP activity and (B) ALP activity. Lysate samples (gray bar) exhibit high activity levels compared with raw scale samples (black bar). Comparisons between the two groups were performed by Student’s t-test. The comparison of the methods was tested by the unpaired t-test method. Data are shown as the mean ± SEM (**** p ≤ 0.0001; *** p ≤ 0.001). Error bars indicate the standard error of the mean.
Acknowledgments
This image is the copyrighted work of the attributed author or publisher, and
ZFIN has permission only to display this image to its users.
Additional permissions should be obtained from the applicable author or publisher of the image.
Full text @ Pharmaceuticals (Basel)