
|
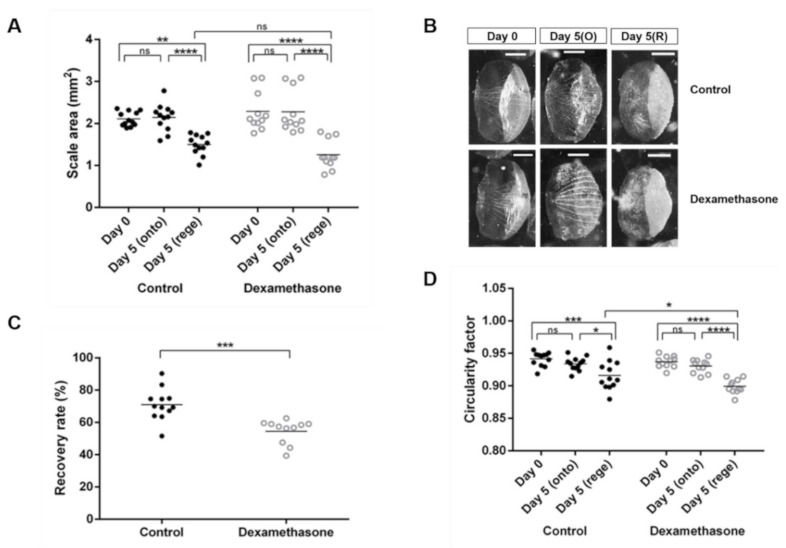
Figure 1 Morphometric analyses of zebrafish scales on day 0, ontogenetic scales on day 5, and regenerated scales on day 5 from the control (black dots) and dexamethasone-treated groups (open dots). Each dot represents an average value of each fish: (A) Scale area (mm2), (B) Representative scales from control and dexamethasone group on day 0 and day 5 (scale bars = 0.5 mm), (C) Percentage of the recovery rate of scale regeneration, (D) Circularity factor (4πA/P2; where A is the surface area and P is the perimeter). Interactions between groups were assessed with two-way ANOVA with Tukey’s multiple comparisons test. Data are shown as the mean ± SEM (**** p ≤ 0.0001; *** p ≤ 0.001; ** p ≤ 0.01; * p ≤ 0.05; ns: not significant). Error bars indicate the standard error of the mean.