
|
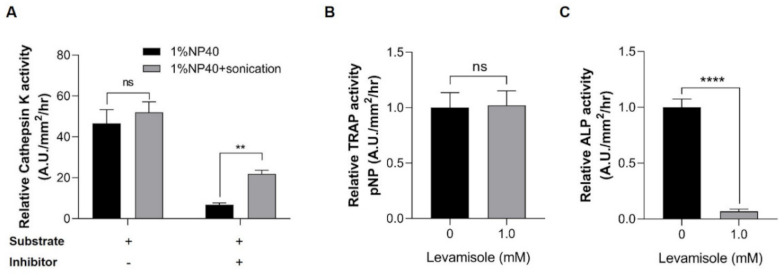
Figure 3 Inhibitor specificity in enzyme assays. (A) Cathepsin K activity. The lysates extracted under 1% NP-40 only (black bar) and 1% NP-40+sonication (gray bar) conditions were used in the cathepsin K assay. The lysates were incubated with a substrate and the presence (+) or absence (−) of cathepsin K inhibitor. The enzymatic activity was calculated as the ratio between the fluorescence values of the lysate and background (relative to 1), (B) TRAP activity, and (C) ALP activity. Lysates extracted under 1% NP-40 and sonication conditions were incubated with an acidic buffer and an alkaline buffer containing pNPP and 1 mM levamisole (an ALP inhibitor) to measure the activities of TRAP and ALP, respectively. These activities were determined using the UV spectroscopy method (λ = 405 nm). Values are presented as the mean ± SEM. Significant differences were calculated by Student’s t-test, with **** p ≤ 0.0001; ** p ≤ 0.01; ns: not significant. Error bars indicate the standard error of the mean.