
- Title
-
Altered Visual Function in a Larval Zebrafish Knockout of Neurodevelopmental Risk Gene pdzk1
- Authors
- Xie, J., Jusuf, P.R., Bui, B.V., Dudczig, S., Sztal, T.E., Goodbourn, P.T.
- Source
- Full text @ Invest. Ophthalmol. Vis. Sci.
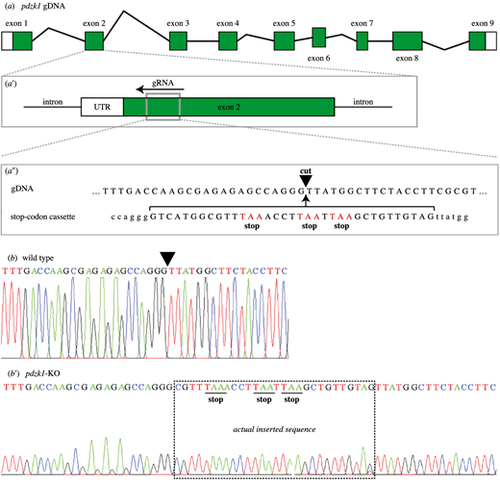
CRISPR editing of pdzk1. (a) There are nine exons in pdzk1 genomic DNA. (a′) The guide RNA (gRNA) targets a site in exon 2 (gray box) and recruits the Cas9 enzyme to recognize and cut the DNA. (a″) The target cut site (black inverted triangle) has homologous arms matching the stop codon template that is co-injected with Cas9 and gRNA during the one-cell stage of zebrafish development. In this way, homology-directed repair inserts the stop codon cassette at exon 2 of pdzk1. Stop codons of the injected cassette are highlighted in red. (b) Sequence results for wild-type fish. The inverted triangle indicates the targeted cut site. (b′) Sequence results for homozygous pdzk1-knockout fish. The box shows the sequence inserted by CRISPR gene editing including the three stop codons (underlined). Sequences on either side were identical to the wild-type fish. |
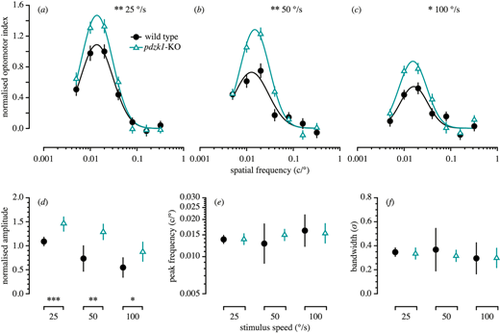
Spatial frequency tuning functions measured using the OMR of wild-type and pdzk1-KO larvae. The upper panels show normalized optomotor index as a function of spatial frequency for wild-type (black circles and lines) and pdzk1-KO larvae (cyan triangles and lines) at (a) 25°/s, (b) 50°/s, and (c) 100°/s. Spatial frequency tuning functions are three-parameter log-Gaussian functions fit to the data by minimizing the least-squares error. Error bars show ± SEM across trials. The bottom panels show (d) normalized amplitude, (e) peak spatial frequency, and (f) bandwidth as a function of group at the three stimulus speeds tested. Error bars show 95% confidence intervals on the fitted parameter. *P < 0.05; **P < 0.01; ***P < 0.001 for the omnibus comparison of functions (upper panels) and for the comparison of individual parameters (lower panels) between genotypes. PHENOTYPE:
|
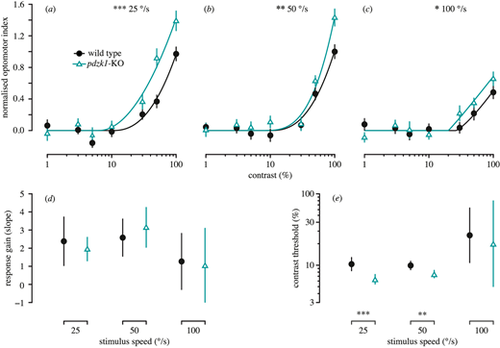
Contrast response functions measured using the OMR in wild-type (black circles and lines) and pdzk1-KO larvae (cyan triangles and lines) at (a) 25°/s, (b) 50°/s, and (c) 100°/s. Contrast response curves are fit to the data using two-parameter piecewise functions by minimizing the least-squares error with respect to the data. Error bars show ±SEM across trials. The bottom panels show (d) response gain and (e) contrast threshold as a function of group at the three stimulus speeds tested. Error bars show 95% confidence intervals on the fitted parameter. *P < 0.05; **P < 0.01; ***P < 0.001 for the omnibus comparison of functions (upper panels) and for the comparison of individual parameters (lower panels) between genotypes. PHENOTYPE:
|
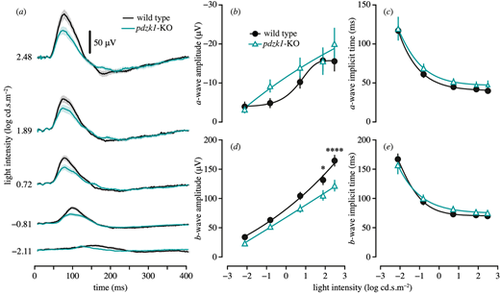
Scotopic ERGs of wild-type and pdzk1-KO larvae. (a) Group average ERG traces. Wild-type and pdzk1-KO larvae responses are shown as black and cyan lines, respectively, at −2.11, −0.81, 0.72, 1.89, and 2.48 log cd·s·m−2. Scale bar: 50 µV. The light bands around group average traces represent ±1 SEM. Note that the a-wave is not visible in the group averages owing to variability in the implicit time, which causes the individual traces to cancel out. Remaining panels show group average (±SEM) (b) a-wave amplitude, (c) a-wave implicit time, (d) b-wave amplitude, and (e) b-wave implicit time for wild-type (black circles) and pdzk1-KO (cyan triangles) larvae. Lines were fit using a four-parameter sigmoidal function. Data were compared using two-way ANOVA with Bonferroni correction. *P < 0.05; ****P < 0.0001. |
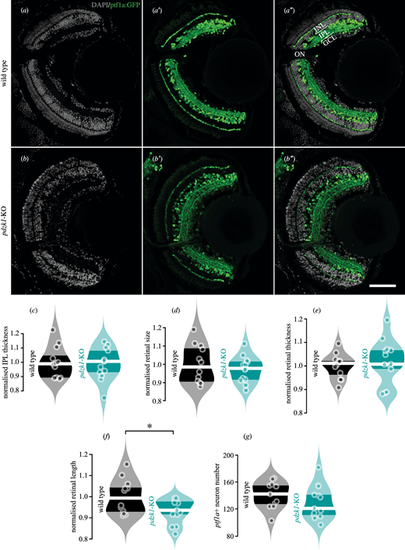
Transgenic labeling of retinal layers and quantification of retinal morphology for wild-type and pdzk1-KO larvae. (a–b″) Inhibitory neurons, including horizontal and amacrine cells, and their projections into the outer and inner plexiform layers were labeled by transgenic construct Tg(ptf1a:GFP) in green, revealing distinct retinal layers in wild-type and pdzk1-KO retinas. Nuclei stained with DAPI are shown in gray. Scale bar: 50 µm. Normalized (c) IPL thickness, (d) retinal size, (e) retinal thickness, (f) retinal length, and (g) ptf1a positive (ptf1a+) neuron number were quantified. Points are data from individual retinas. White lines represent medians, and dark bands indicate interquartile ranges. For all analyses, unpaired t-tests were performed with 12 and 13 retinas for wild-type and pdzk1-KO groups, respectively. *P < 0.05. INL, inner nuclear layer; IPL, inner plexiform layer; GCL, ganglion cell layer; ON, optic nerve. |
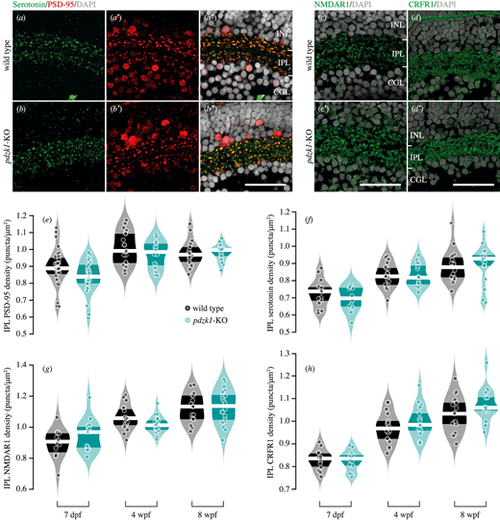
Immunostaining and density quantification of PDZK1-interacting molecules in wild-type and pdzk1-KO retinas. Micrographs of retinal sections from 7-dpf wild-type and pdzk1-KO larvae were co-labeled with (a–b″) serotonin and PSD-95 in green and red, respectively. (c, c′) NMDAR1 and (d, d′) CRFR1 were labeled in green for 7-dpf retinas. For all images, nuclei were stained with DAPI, shown in gray. Scale bars: 25 µm. Violin plots show densities of (e) PSD-95, (f) serotonin, (g) NMDAR1, and (h) CRFR1 in the IPL at 7 dpf, 4 wpf, and 8 wpf. Points are data from individual retinas. White lines represent medians, and dark bands indicate interquartile ranges. Statistical comparisons were performed using two-way ANOVA with Bonferroni correction and Bayesian ANOVA. There were between 12 and 31 retinas per group (see Supplementary information). BFinclusion < 0.33 was considered to be evidence for the null hypothesis (i.e., the data are at least three times as likely under the null hypothesis than the alternative). EXPRESSION / LABELING:
|
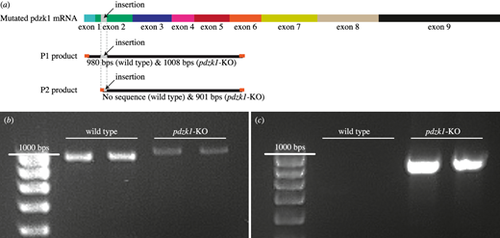
Standard RT-PCR for testing splice variants, exon skipping, and expression of pdzk1 in wild-type fish and pdzk1-KO mutants. (a) Schematics of the two primer pairs for pdzk1 mRNA and their products. Pdzk1 mRNA is expressed from the nine exons of pdzk1 genomic DNA. In mutants, the insertion (highlighted in gray on the pdzk1 mRNA sequence and primer products) should also be expressed within the exon 2 region (green) of the mRNA. Primer pair 1 (P1) was designed to amplify the mRNA region across exons 1 to 6 containing the insertion, producing 980-bp products for wild-type fish and longer (1008-bp) products for mutants due to the insertion. Primer pair 2 (P2) was designed to amplify the mutated pdzk1 mRNA sequence, which starts within the insertion in exon 2 and ends in exon 6. P2 produces 901-bp products only for mutants, with no product for wild-type controls. Orange ends of products represent primers. (b) As expected, standard RT-PCR using P1 produced slightly longer products for mutants than for wild-type fish. (c) RT-PCR using P2 produced ∼900-bp products for mutants but no amplified sequence for wild-type fish. |
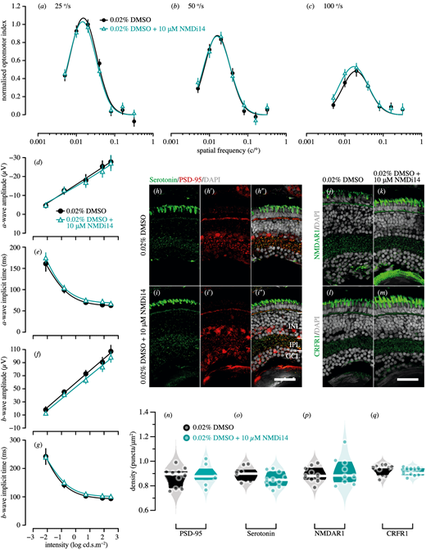
Genetic compensation tests for pdzk1-KO mutants at 7 dpf. Spatial frequency tuning functions were fitted by a log-Gaussian model for control (pdzk1-KO mutants treated with 0.02% DMSO; black circles and lines) and experimental groups (pdzk1-KO mutants treated with 0.02% DMSO and 10-µM NMDi14; blue triangles and lines) at (a) 25°/s, (b) 50°/s, and (c) 100°/s. ERG results were shown as the group average (±SEM) of (d) a-wave amplitude, (e) a-wave implicit time, (f) b-wave amplitude, and (g) b-wave implicit time for pdzk1-KO mutants treated with 0.02% DMSO (filled black circles) and mutants treated with 0.02% DMSO and 10-µM NMDi14 (open cyan triangles). Data were compared using two-way ANOVA; there were no significant differences. Lines were fit by a four-parameter sigmoidal function. For histological assessment, (h–i″) serotonin and PSD-95 were co-labeled in green and red, respectively, for both groups; (j, k) NMDAR1and (l, m) CRFR1 were labeled in green. For all images, nuclei were stained with DAPI, shown in gray. Scale bars: 25 µm. Violin plots show densities in the IPL of (n) PSD-95, (o) serotonin, (p) NMDAR1, and (q) CRFR1 for mutants treated with 0.02% DMSO (black circles) and mutants treated with 0.02% DMSO and 10-µM NMDi14 (cyan circles). Points represent data from individual retinas. White lines represent medians, and dark bands indicate interquartile ranges. Unpaired t-tests were performed with 10 or 11 retinas per group (see Supplementary Table S6). |