|
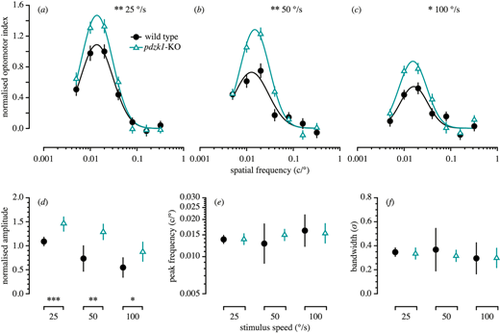
Spatial frequency tuning functions measured using the OMR of wild-type and pdzk1-KO larvae. The upper panels show normalized optomotor index as a function of spatial frequency for wild-type (black circles and lines) and pdzk1-KO larvae (cyan triangles and lines) at (a) 25°/s, (b) 50°/s, and (c) 100°/s. Spatial frequency tuning functions are three-parameter log-Gaussian functions fit to the data by minimizing the least-squares error. Error bars show ± SEM across trials. The bottom panels show (d) normalized amplitude, (e) peak spatial frequency, and (f) bandwidth as a function of group at the three stimulus speeds tested. Error bars show 95% confidence intervals on the fitted parameter. *P < 0.05; **P < 0.01; ***P < 0.001 for the omnibus comparison of functions (upper panels) and for the comparison of individual parameters (lower panels) between genotypes.
|