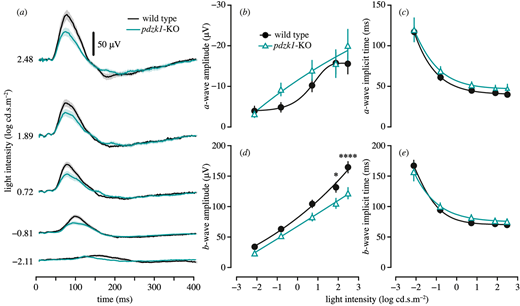
Fig. 4 Scotopic ERGs of wild-type and pdzk1-KO larvae. (a) Group average ERG traces. Wild-type and pdzk1-KO larvae responses are shown as black and cyan lines, respectively, at −2.11, −0.81, 0.72, 1.89, and 2.48 log cd·s·m−2. Scale bar: 50 µV. The light bands around group average traces represent ±1 SEM. Note that the a-wave is not visible in the group averages owing to variability in the implicit time, which causes the individual traces to cancel out. Remaining panels show group average (±SEM) (b) a-wave amplitude, (c) a-wave implicit time, (d) b-wave amplitude, and (e) b-wave implicit time for wild-type (black circles) and pdzk1-KO (cyan triangles) larvae. Lines were fit using a four-parameter sigmoidal function. Data were compared using two-way ANOVA with Bonferroni correction. *P < 0.05; ****P < 0.0001.
Image
Figure Caption
Acknowledgments
This image is the copyrighted work of the attributed author or publisher, and
ZFIN has permission only to display this image to its users.
Additional permissions should be obtained from the applicable author or publisher of the image.
Full text @ Invest. Ophthalmol. Vis. Sci.

