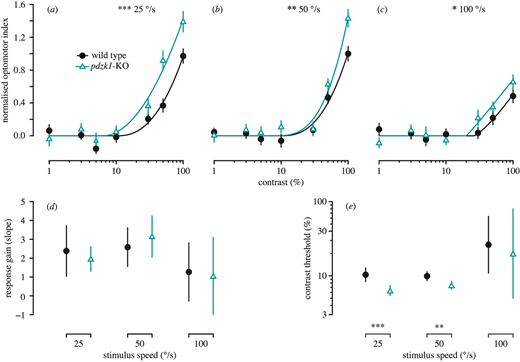
Fig. 3 Contrast response functions measured using the OMR in wild-type (black circles and lines) and pdzk1-KO larvae (cyan triangles and lines) at (a) 25°/s, (b) 50°/s, and (c) 100°/s. Contrast response curves are fit to the data using two-parameter piecewise functions by minimizing the least-squares error with respect to the data. Error bars show ±SEM across trials. The bottom panels show (d) response gain and (e) contrast threshold as a function of group at the three stimulus speeds tested. Error bars show 95% confidence intervals on the fitted parameter. *P < 0.05; **P < 0.01; ***P < 0.001 for the omnibus comparison of functions (upper panels) and for the comparison of individual parameters (lower panels) between genotypes.
Image
Figure Caption
Figure Data
Acknowledgments
This image is the copyrighted work of the attributed author or publisher, and
ZFIN has permission only to display this image to its users.
Additional permissions should be obtained from the applicable author or publisher of the image.
Full text @ Invest. Ophthalmol. Vis. Sci.

