- Title
-
Py3-FITC: a new fluorescent probe for live cell imaging of collagen-rich tissues and ionocytes
- Authors
- Wang, Z., Mizoguchi, T., Kuribara, T., Nakajima, M., Iwata, M., Sakamoto, Y., Nakamura, H., Murayama, T., Nemoto, T., Itoh, M.
- Source
- Full text @ Open Biol.
|
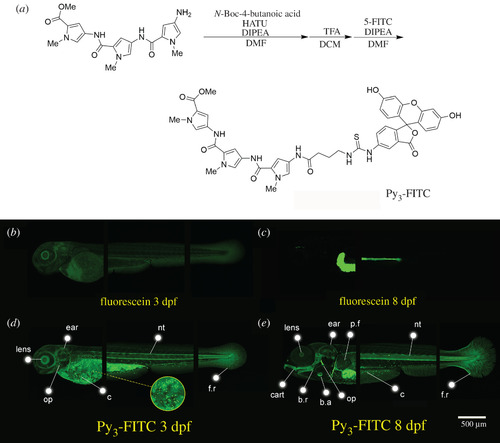
Py3-FITC can stain several tissues of zebrafish embryos. (a) Experimental procedure for the synthesis of Py3-FITC. Additionally, see electronic supplementary material, file S1 and figure S1. (b,c) Lateral view of fluorescein-stained zebrafish and (d,e) Py3-FITC-stained zebrafish embryos at (b,d) 3 dpf and (c,e) 8 dpf. Py3-FITC-stained lens, ear, opercle (op), notochord (nt) and cells distributed on the surface of the yolk sac and trunk region (c), fin rays (f.r.) 3 dpf. Jaw cartilage (cart), branchiostegal rays (b.r.), b.a. and pectoral fins (p.f.) were also stained 8 dpf. Scale bar in e, 500 µm. |
|
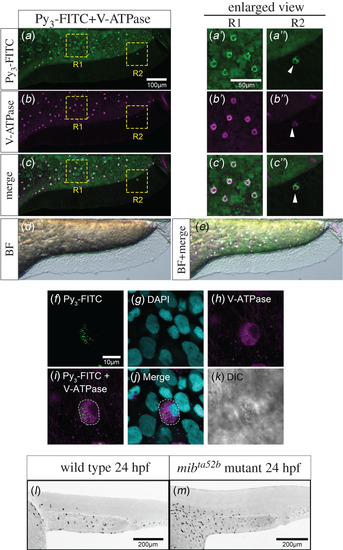
Py3-FITC-positive cells on the yolk and trunk surface are HR cells. Lateral views of Py3-FITC and anti-V-ATPase antibody double-stained zebrafish embryos at 3 dpf. (a) Py3-FITC-stained cells and (b) V-ATPase-expressing cells mostly overlapped (c). (d) Bright field image. (e) The overlaid image of c and d. Enlarged views of R1 and R2 region of Py3-FTIC staining (a′, a″), V-ATPase staining (b′, b″) and merged view (c′, c″) are also shown here. The white arrowhead indicates Py3-FITC-positive HR cell on the ventral fin (a″, b″, c″). (f–k) High magnification view of Py3-FITC-stained HR cells in 3 dpf fixed zebrafish. The projected image of Py3-FITC staining (f), the projected image of DAPI staining (g), the projected image of V-ATPase antibody staining (h), The overlaid image (i) of f and h, merged view (j) and DIC image (k) are shown. (l,m) Lateral views of Py3-FITC-stained wild-type (l) and mibta52b-mutant (m) zebrafish embryos at 24 hpf. Embryos were treated with 10 μM Py3-FITC for 5 h from 19 hpf (l, m). Py3-FITC-positive cells were significantly increased in Notch signalling-deficient mibta52b embryos. Scale bars in a, 100 µm; a′, 50 µm; f, 10 µm; l, m, 200 µm. |
|
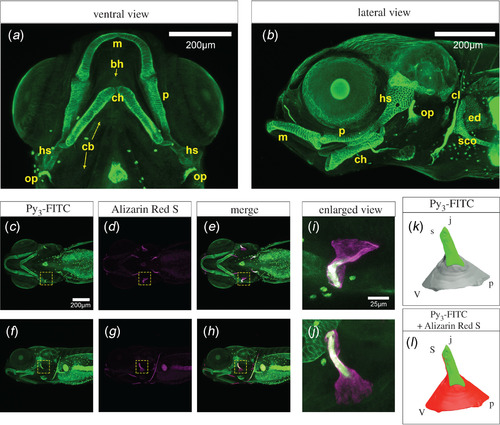
Cartilage tissues were stained with Py3-FITC. (a) Ventral and (b) lateral views of Py3-FITC-stained cartilage tissues 10 dpf. Meckel's (m), palatoquadrate (p), hyosymplectic (hs), ceratohyal (ch), scapulocoracoid (sco), cleithrum (cl), endoskeletal disc (ed) and opercle (op) were stained. (c–e) Ventral and (f–h) lateral views of Py3-FITC and Alizarin Red S double-stained zebrafish embryos 7 dpf. (i,j) Enlarged view of the yellow dotted squares shown in e, h. (k,l) Graphical illustration of Py3-FITC- and Alizarin Red S-stained opercles in i and j. Green indicates the Py3-FITC-stained region, and red indicates the Alizarin Red S-stained region of the opercles. The Py3-FITC-stained region was partially merged with the Alizarin Red-stained region. Parts of the opercle, joint apex (j), ventral (v), posterior (p) and joint socket (s) were visualized. Scale bars in a, b, c, 200 μm; i, 25 μm. |
|
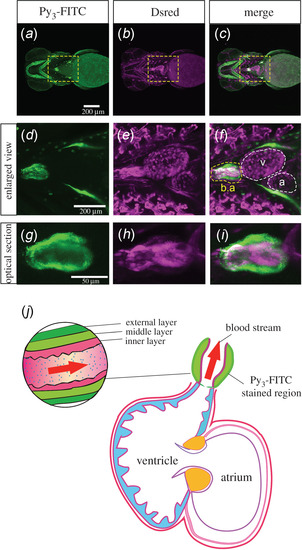
Bulbus arteriosus was stained with Py3-FITC. (a–c) Ventral view of the head and cardiomyocytes of Py3-FITC-stained Tg(fli:dsRed);casper zebrafish 7 dpf. (d–f) Enlarged views of the yellow boxed regions shown in a–c. Py3-FITC-stained b.a. but not the atrium (a) or ventricle (v) region. (g–i) Optical section views of Py3-FITC-stained and DsRed-positive regions in the b.a.. The graphical cross-sectional view of the zebrafish heart, which consists of the b.a., atrium and ventricle (j). The b.a. consists of inner and middle/external layers. Red arrows represent the direction of the bloodstream. The Py3-FITC-stained region is the middle/external layers of the b.a.. Scale bars in a, 200 µm; g, 50 µm. |
|
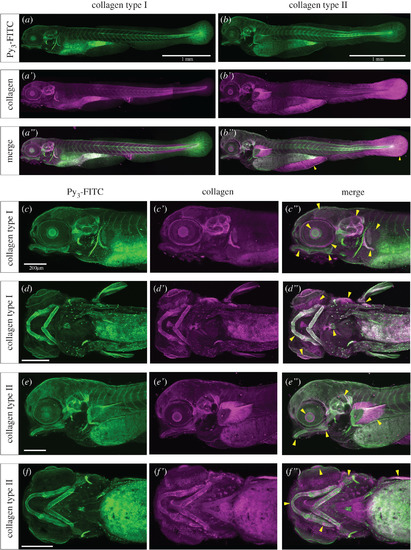
Py3-FITC can stain collagen type I- or II-positive tissues in zebrafish embryos. Reconstructed (a–b″,c–c″,e–e″) lateral views and (d–d″,f–f″) ventral views of the Py3-FITC and anti-collagen (a–a″,c–d″) type I and (b–b″,e–f″) type II antibody-stained zebrafish embryos at 5 dpf. (a″,b″,c″,d″,e″,f″) Py3-FITC-stained regions overlapped with collagen type I- or type II-positive regions. The yellow arrowheads represent Py3-FITC and collagen expression overlapping regions (b″,c″,d″,e″,f″). Enlarged views are shown of collagen (c′,d′) type I- and (e′,f′) type II-stained regions and their merged images (c″,d″,e″,f″). Scale bars in a,b, 1 mm; c,d,e,f, 200 μm. |
|
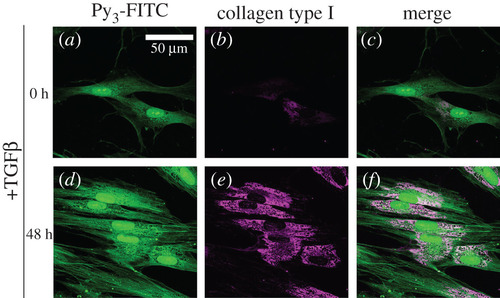
Py3-FITC can be used to detect TGF-β1-induced collagen type I. HFL-1 cells were treated with TGF-β1 for 0 h (a–c) or 48 h (d–f) and then stained with Py3-FITC (a,d) and collagen type I antibody (b,e), and their merged images are shown (c,f). Collagen type I expression was increased by 48 h of TGF-β1 treatment. The cytoplasmic signal of Py3-FITC was also increased by TGF-β1 and was partially merged with that of collagen type I (c,f). Scale bar in a, 50 μm. |

