
- Title
-
SATB2 induction of a neural crest mesenchyme-like program drives melanoma invasion and drug resistance
- Authors
- Fazio, M., van Rooijen, E., Dang, M., van de Hoek, G., Ablain, J., Mito, J.K., Yang, S., Thomas, A., Michael, J., Fabo, T., Modhurima, R., Pessina, P., Kaufman, C.K., Zhou, Y., White, R.M., Zon, L.I.
- Source
- Full text @ Elife
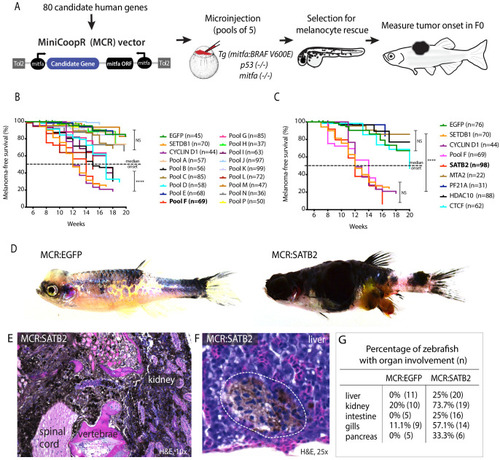
(A) Schematic overview of screening strategy: MCR expression vector-based reintroduction of the melanocyte master transcription factor mitfa, rescues melanocytes and melanoma development. All rescued melanocytes in F0 microinjected embryos also express a candidate human factor. (B) Kaplan-Meier melanoma-free survival curves of pooled chromatin factor screen. Six pools were significant [Log-rank (Mantel-Cox) test p<0.0001****]. Pool F (red) had the strongest acceleration effect (Median onset 14 weeks). (C) Single factor validation of pool F identifies SATB2 to induce accelerated melanoma onset [Median onset 12 weeks, Log-rank (Mantel-Cox) test, p<0.0001****]. (D) Zebrafish MCR:SATB2 tumors are aggressive compared to an MCR:EGFP age-matched control. (E) Histopathological analysis revealed that MCR:SATB2 tumors are highly invasive, here shown to invade through the spinal cord, vertebrae, and kidney. (F) Isolated melanoma cell clusters were found in the liver, and (G) frequent organ involvement is observed in MCR:SATB2 compared to MCR:EGFP controls. |
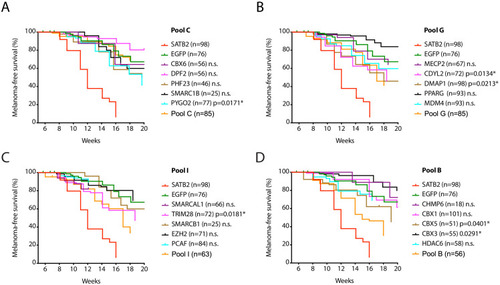
Kaplan-Meier melanoma-free survival curves of single factor validation of non-significant pool C ( |
( |
( |
( |
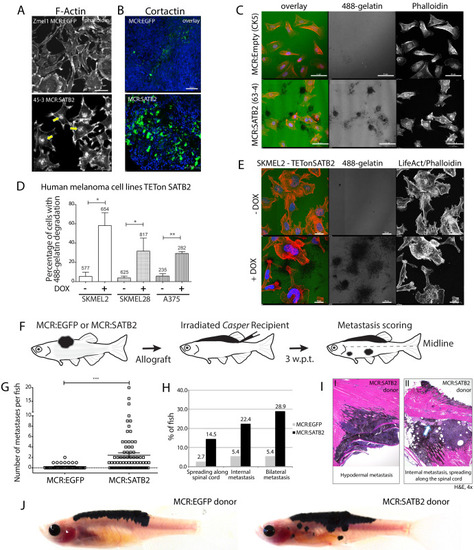
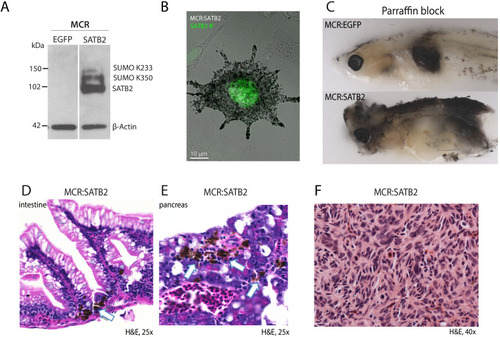
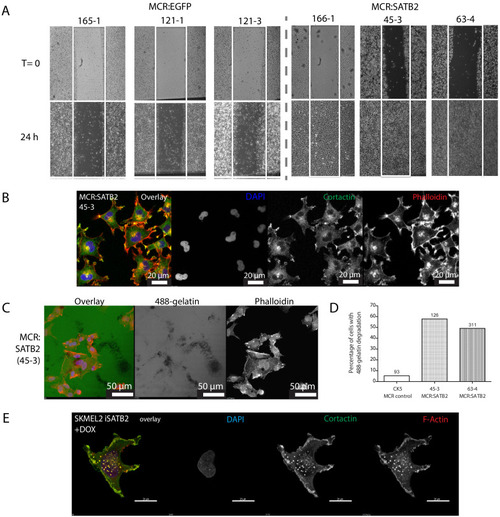
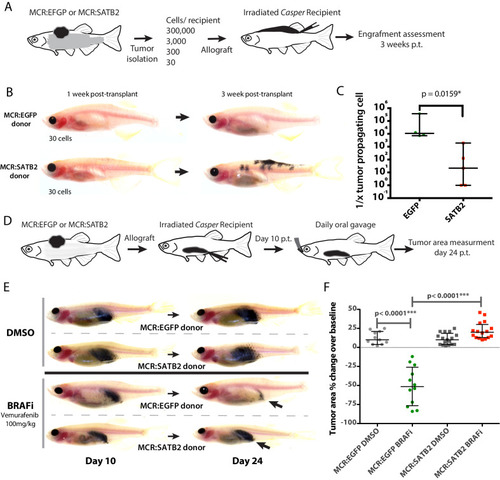
(A) Phalloidin staining for F-Actin in primary zebrafish melanoma cell culture, reveals the presence of F-actin-positive foci in MCR:SATB2 (45–3) cells, which are not present in MCR:EGFP (zmel1) cells. Scale bar is 20 μm. Primary tumor immunohistochemistry shows MCR:SATB2 tumors abundantly express Cortactin. Scale bar 50 μm. (B) MCR:SATB2 (63–4) cells show increased Oregon green 488-conjungated gelatin degradation, compared to MCR (CK5) cells 24–25 hr post-seeding. Scale bar is 50 μm. (C) Percentage of cells with degraded gelatin after SATB2 induction in iSATB2 human melanoma cell lines A375, SKMEL2, and SKMEL28 transduced with pInducer20-SATB2. Cells were seeded on gelatin in media +/- doxycycline after 48 hr +/- doxycycline induction. (D) Upon SATB2 induction in human melanoma cell line SKMEL2, cells form invadopodia and show increased matrix degradation Scale bar is 20 μm. (E) Orthotropic allograft migration assay in transparent Casper zebrafish. A total of 300,000 primary pigmented primary melanoma cells were transplanted into the dorsum of irradiated Casper recipients, which are monitored for the formation of pigmented distant metastasis that have spread past the anatomical midline. Metastases are represented as black circles. (F) Pooled recipient data at the experimental end point at 3.5 weeks post-transplantation, 59.4 ± 2.3% (SEM; n = 76 total recipients, grafted from seven individual donor tumors) of MCR:SATB2 transplants formed distant metastasis, compared to 21.8±4.5% (SEM; n = 37 total recipients grafted from five individual donor tumors) of EGFP-control transplants (p<0.0001). MCR:EGFP transplants developed an average 1.1 ± 0.4 (SD) distant metastasis per fish, versus 4 ± 4.2 (SD) in MCR:SATB2, where a maximum of 20 metastases per fish was observed. (G) MCR:SATB2 recipients more frequently developed bilateral (28.9%), and internal metastases (22.4%) compared to MCR:EGFP donors (5.4%), showing spreading along the neural tube (14.5% versus 2.7%). (H) At 3.5 weeks-post transplantation, compared to MCR:EGFP donor transplants, MCR:SATB2 transplants develop distant and internal metastases. Histopathology of MCR:SATB2 Casper recipients showing a (I–I) hypodermal metastasis, and (I–II) internal metastasis with spreading along neural tube. |
( |
( |
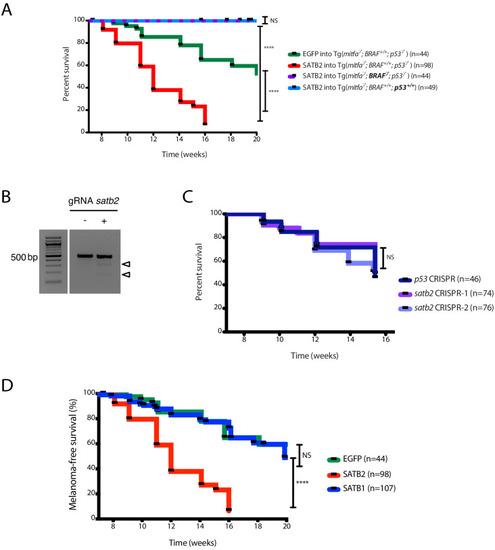
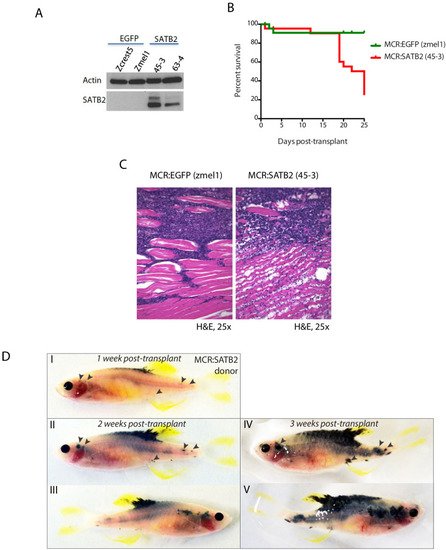
(A) Western blot of SATB2 showing retained expression in long term in vitro cultures derived from MCR:SATB2 tumors. Actin loading control is shown. (B) Overall survival and (C) histology of irradiated Casper recipients transplanted with MCR:EGFP Zmel1 (n = 31) or MCR:SATB2 45–3 (n = 31) zebrafish long term in vitro cultures. (D) Weekly prospective imaging of primary MCR:SATB2 individual tumor donor allograft in irradiated Casper recipient. Arrows indicate distant metastasis from injection site. Related to Figure 2H. |
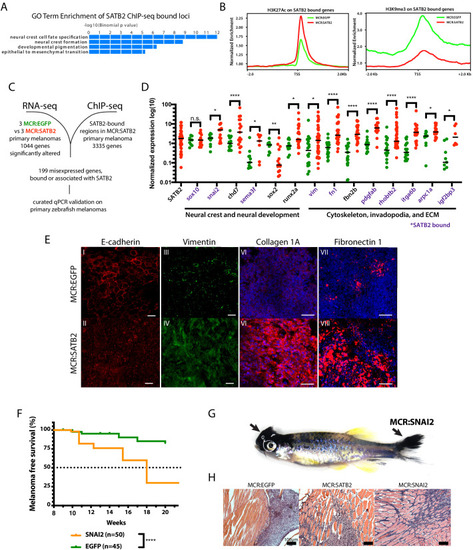
(A) GO-term enrichment of SATB2-bound loci (GREAT analysis) from anti-SATB2 ChIp-seq on MCR:SATB2 tumors. Genes are defined as bound if SATB2 peaks are found within 3 kb of the transcriptional start (TSS) or end site (TES), and the gene body (GB). (B) H3K27Ac and H3K9me3 TSS +/- 2 Kb profile of H3K27Ac at SATB2 bound targets comparing MCR:SATB2 in red and MCR:EGFP in green. (C) ChIP-seq and significant differentially expressed genes RNA-seq (p<0.05, q < 0.05, FC>|1.5|) overlap was performed on primary zebrafish tumors to identify SATB2-bound genes that are misregulated. (D) qRT-PCR validation of transcriptionally altered SATB2-bound and associated targets associated to neural crest development, and the actin cytoskeleton and extracellular matrix. Symbols indicate single primary tumors, normalized to β-actin. *p<0.05, ***p<0.0001, ****p<0.0001. SATB2-bound genes are highlighted in purple. (E) Whole mount primary tumor immunohistochemistry for E-cadherin (red), scale bar is 100 μm, Vimentin (green), scale bar is 100 μm, Fibronectin 1 (red), scale bar is 50 μm, and Collagen 1 (red), scale bar is 50 μm, Dapi (blue). (F) Injection in MCR model as described in Figure 1A of MCR:EGFP, and MCR:SNAI2. (Log-rank (Mantel-Cox) test p<0.0001****). (G) Gross anatomy of zebrafish injected with MCR:SNAI2. Arrows show melanomas. (H) H and E representative histology of MCR:EGFP, MCR:SATB2, and MCR:SNAI2 tumors. Black bar is 100 µm. |
( |
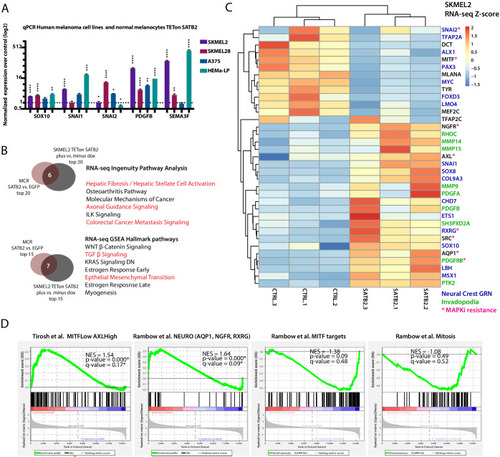
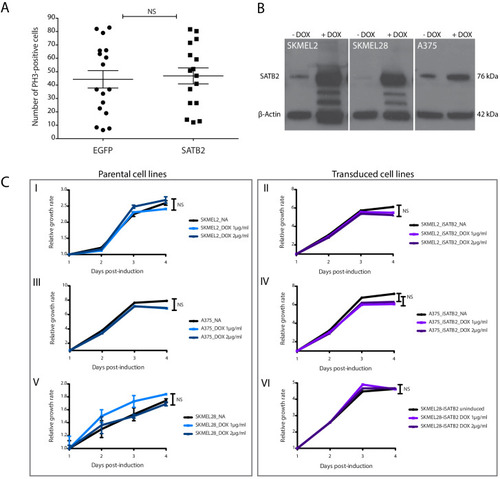
(A) Overexpression of SATB2 with TETon (iSATB2) in normal human epidermal melanocytes (HEMA-LP) and in SKMEL2, SKMEL28, and A375 melanoma cells is sufficient to induce transcriptional activation of SOX10, SNAI1/2, PDGFB, and SEMA3F mRNA. qRT-PCR Data was normalized to beta-actin, and fold change was determined compared to un-induced controls. *p<0.05, **p<0.001, ***p<0.0001, ****p<0.0001. (B) Overlap of Ingenuity Pathway Analysis and Gene Set Enrichment Analysis Hallmark pathways of RNA-seq in MCR zebrafish tumors and iSKMEL2 human (plus vs. minus doxycycline) melanoma cell line. For IPA humanized significant zebrafish genes were used (p<0.05, q < 0.05, FC>|1.5|=1044 zf->840 unique human orthologs), and significant SKMEL2 iSATB2 genes (p<0.05, q < 0.05, FC>|1|). (C) Curated heatmap of altered genes in RNA-seq of human SKMEL2 cells overexpressing SATB2 (plus DOX vs. minus DOX FC >1; p<0.01) that have been involved in neural crest or Rambow Neural crest-like state, PDGF-PDGFR-SRC invadopodia cascade, AXL/MITF state and melanocyte differentiation. All genes shown are significantly altered except for TFAP2C. Normalized RNA-seq heatmap of expression fold change Z-score is plotted. Genes part of the neural crest GRN are highlighted in blue, invadopodia related genes are highlighted in green, and MAPK inhibitors resistance genes are highlighted in magenta. (D) Gene set enrichment analysis (GSEA) of 1000 MSigDB signatures including the states described by Tirosh et al. and Rambow et al. |
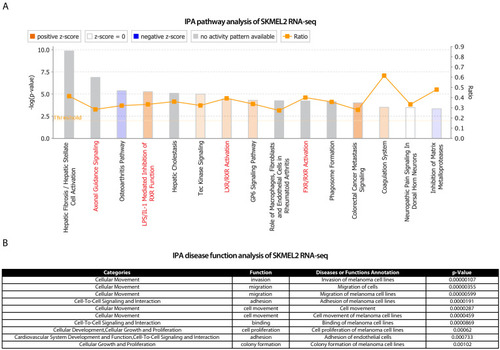
IPA analysis on ( |
( |