
|
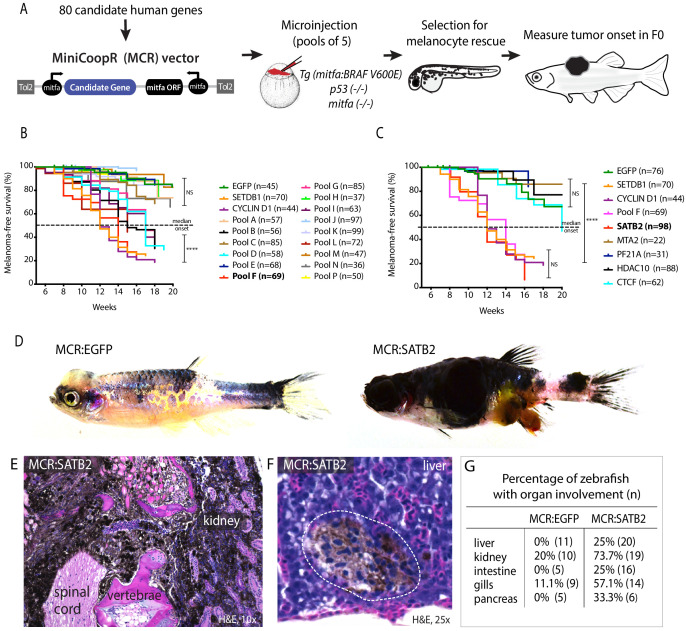
Figure 1 (A) Schematic overview of screening strategy: MCR expression vector-based reintroduction of the melanocyte master transcription factor mitfa, rescues melanocytes and melanoma development. All rescued melanocytes in F0 microinjected embryos also express a candidate human factor. (B) Kaplan-Meier melanoma-free survival curves of pooled chromatin factor screen. Six pools were significant [Log-rank (Mantel-Cox) test p<0.0001****]. Pool F (red) had the strongest acceleration effect (Median onset 14 weeks). (C) Single factor validation of pool F identifies SATB2 to induce accelerated melanoma onset [Median onset 12 weeks, Log-rank (Mantel-Cox) test, p<0.0001****]. (D) Zebrafish MCR:SATB2 tumors are aggressive compared to an MCR:EGFP age-matched control. (E) Histopathological analysis revealed that MCR:SATB2 tumors are highly invasive, here shown to invade through the spinal cord, vertebrae, and kidney. (F) Isolated melanoma cell clusters were found in the liver, and (G) frequent organ involvement is observed in MCR:SATB2 compared to MCR:EGFP controls.