
Figure 3
- ID
- ZDB-FIG-210218-35
- Publication
- Fazio et al., 2021 - SATB2 induction of a neural crest mesenchyme-like program drives melanoma invasion and drug resistance
- Other Figures
-
- Figure 1
- Figure 1—figure supplement 1—source data 1.
- Figure 1—figure supplement 2.
- Figure 1—figure supplement 3.
- Figure 1—figure supplement 4.
- Figure 2
- Figure 2—figure supplement 1.
- Figure 2—figure supplement 2.
- Figure 2—figure supplement 3.
- Figure 3
- Figure 3—figure supplement 1.
- Figure 4—figure supplement 1.
- Figure 4—figure supplement 1.
- Figure 5.
- All Figure Page
- Back to All Figure Page
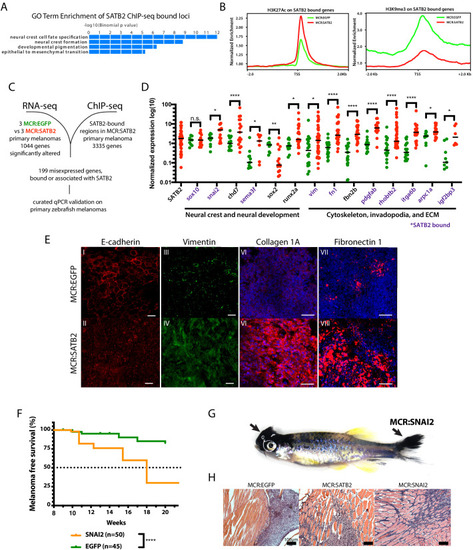
(A) GO-term enrichment of SATB2-bound loci (GREAT analysis) from anti-SATB2 ChIp-seq on MCR:SATB2 tumors. Genes are defined as bound if SATB2 peaks are found within 3 kb of the transcriptional start (TSS) or end site (TES), and the gene body (GB). (B) H3K27Ac and H3K9me3 TSS +/- 2 Kb profile of H3K27Ac at SATB2 bound targets comparing MCR:SATB2 in red and MCR:EGFP in green. (C) ChIP-seq and significant differentially expressed genes RNA-seq (p<0.05, q < 0.05, FC>|1.5|) overlap was performed on primary zebrafish tumors to identify SATB2-bound genes that are misregulated. (D) qRT-PCR validation of transcriptionally altered SATB2-bound and associated targets associated to neural crest development, and the actin cytoskeleton and extracellular matrix. Symbols indicate single primary tumors, normalized to β-actin. *p<0.05, ***p<0.0001, ****p<0.0001. SATB2-bound genes are highlighted in purple. (E) Whole mount primary tumor immunohistochemistry for E-cadherin (red), scale bar is 100 μm, Vimentin (green), scale bar is 100 μm, Fibronectin 1 (red), scale bar is 50 μm, and Collagen 1 (red), scale bar is 50 μm, Dapi (blue). (F) Injection in MCR model as described in Figure 1A of MCR:EGFP, and MCR:SNAI2. (Log-rank (Mantel-Cox) test p<0.0001****). (G) Gross anatomy of zebrafish injected with MCR:SNAI2. Arrows show melanomas. (H) H and E representative histology of MCR:EGFP, MCR:SATB2, and MCR:SNAI2 tumors. Black bar is 100 µm. |