
IMAGE
Figure 1—figure supplement 1—source data 1.
- ID
- ZDB-IMAGE-210218-26
- Source
- Figures for Fazio et al., 2021
Image
|
Figure Caption
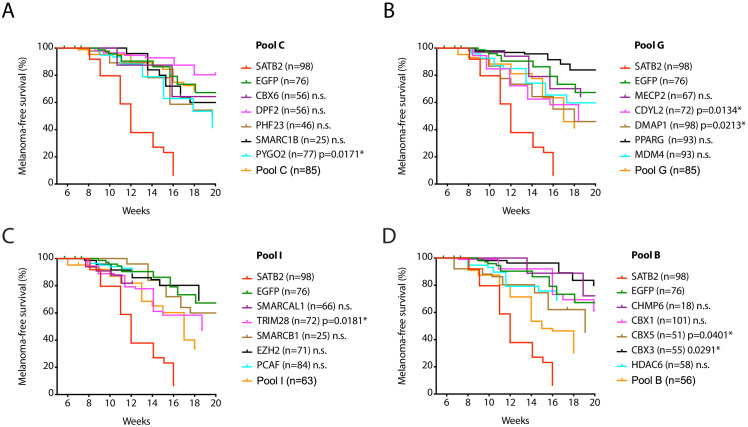
Figure 1—figure supplement 1—source data 1.
Kaplan-Meier melanoma-free survival curves of single factor validation of non-significant pool C (
Acknowledgments
This image is the copyrighted work of the attributed author or publisher, and
ZFIN has permission only to display this image to its users.
Additional permissions should be obtained from the applicable author or publisher of the image.
Full text @ Elife