- Title
-
Poly(U)-specific endoribonuclease ENDOU promotes translation of human CHOP mRNA by releasing uORF element-mediated inhibition
- Authors
- Lee, H.C., Fu, C.Y., Lin, C.Y., Hu, J.R., Huang, T.Y., Lo, K.Y., Tsai, H.Y., Sheu, J.C., Tsai, H.J.
- Source
- Full text @ EMBO J.
|
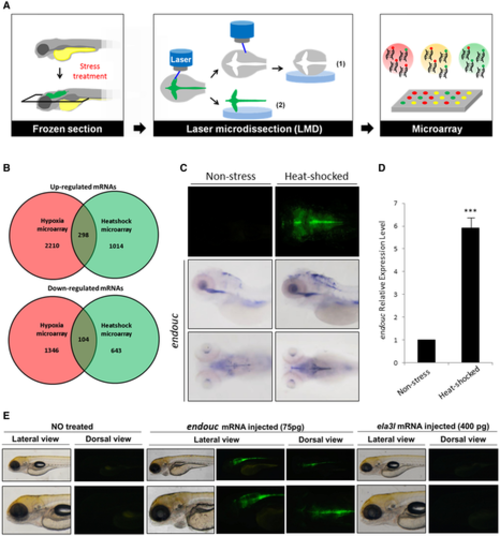
Schematic diagram illustrating the separation of GFP-expressing and non-GFP-expressing cells from stress-treated zebrafish embryos of transgenic line huORFZ using LMD methods followed by microarrays. Graphical representation of two microarray expression analyses. A total of 298 over-represented transcripts and 104 under-represented transcripts were obtained from both microarrays. Upper panels: top view of EGFP expressed in zebrafish embryos derived from zebrafish transgenic line huORFZ under non-stress and heat-shock treatment. Middle panels: lateral view of endouc expression patterns in embryos under non-stress condition and treated with heat-shock. Lower panels: top view of endouc expression patterns. Quantitative RT–PCR determined the relative expression level of endouc mRNA in non-stress- and heat-shock-treated embryos. Values representing the non-stress- and heat-shocked conditions were calculated from three independent experiments and presented as mean ± SD (n = 3). Student's t-test was used to determine significant differences between each group (***P < 0.001). The endouc and ela3l (negative control) mRNAs were separately microinjected into zebrafish embryos from huORFZ at one-cell stage. Upper panels: observation of GFP signal expressed in huORFZ embryos at 72 hpf. Lower panels: magnification of pictures corresponding to the upper panels. |
|
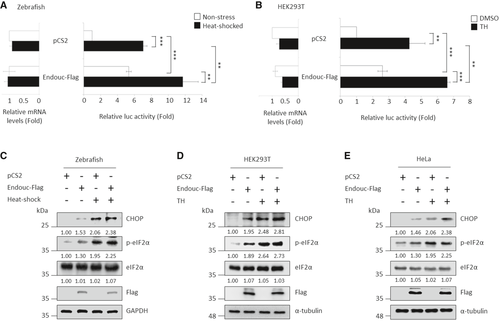
Histograms show the luc activity obtained from zebrafish embryos microinjected simultaneously with puORFchop-luc, phRG-TK, and each indicated plasmid followed by analysis of luc activity at 96 hpf. Embryos microinjected with pCS2 vector during normal condition (non-stress; blank column) served as a control group, while the microinjected embryos treated with 40°C at 72 hpf for 1 h were the heat-shocked group (solid column). The relative luc activity of microinjected embryos shown on the right was normalized by the amount of RNA in the injected embryos shown on the left. The relative luc activity was represented by the fold increase of Fluc/Rluc ratio over that obtained from the control group (this was normalized to 1). The luc activity mediated by the huORFchop transcript was measured by dual-luciferase assay, and its corresponding huORFchop-luc transcript was measured by RT–qPCR. Values representing the non-stress and stress condition were calculated from three independent experiments and presented as mean ± SD (n = 3). Student's t-test was used to determine significant differences between each group (**P < 0.005, ***P < 0.001). B. Histograms present the luc activity obtained from HEK293T cells co-transfected with puORFchop-luc, phRG-TK, and each indicated plasmid and then treated with either DMSO (control group) or thapsigargin (TH; stress group), followed by analysis of luc activity. Cells transfected with pCS2-vector and kept at normal condition served as a control group. The relative luc activity of transfected cells shown on the right was normalized by the amount of mRNA in the transfected cells shown on the left. The relative luc activity was represented by the fold increase of Fluc/Rluc ratio over that obtained from pCS2-transfected control group (this was normalized to 1). The luc activity mediated by the huORFchop transcript was measured by dual-luciferase assay, and its corresponding huORFchop-luc transcript was measured by RT–qPCR. Values representing the non-stress and stress conditions were calculated from three independent experiments and presented as mean ± SD (n = 3). Student's t-test was used to determine significant differences between each group (**P < 0.005, ***P < 0.001). C–E. Western blot analysis of proteins, as indicated, in (C) zebrafish embryos, (D) HEK293T cells and (E) HeLa cells. GAPDH and α-tubulin served as internal controls. Protein levels relative to each internal control are presented below each lane. |
|
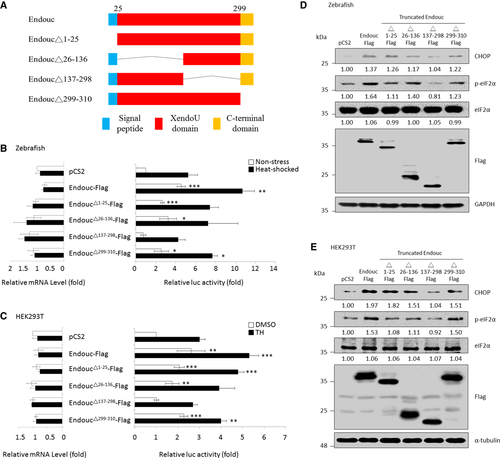
Schematic representation of zebrafish Endouc protein and its internal deletion mutants.‡ Histograms presenting the relative luc activity obtained from zebrafish embryos microinjected simultaneously with puORFchop-luc, phRG-TK, and each of the expression plasmids as indicated followed by analysis of luc activity at 96 hpf. Embryos microinjected with pCS2 vector during normal condition served as a control group (non-stress; blank column), while the microinjected embryos treated with 40°C at 72 hpf for 1 h were the heat-shocked group (solid column). The relative luc activity of microinjected embryos shown on the right was normalized by the amount of RNA in the injected embryos shown on the left. The relative luc activity is represented by the fold increase in Fluc/Rluc ratio over that obtained from control group. The luc activity mediated by the huORFchop element was measured by a dual-luciferase assay, and its corresponding huORFchop-luc transcript was measured by RT–qPCR. Histograms presented the luc activity obtained from HEK293T cells co-transfected with puORFchop-luc, phRG-TK, and each one of the plasmids as indicated and treated with either DMSO (control group) or thapsigargin (TH; stress group) followed by analysis of luc activity. The luc activity of cells transfected with pCS2 vector and kept at normal condition served as a control group. The relative luc activity of transfected cells shown on the right was normalized by the amount of RNA in the transfected cells shown on the left. The relative luc activity is represented by the fold increase of Fluc/Rluc ratio over that obtained from pCS2-transfected control group normalized as 1. The luc activity mediated by the huORFchop transcript was measured by the dual-luciferase assay, and its corresponding huORFchop-luc transcript was measured by RT–qPCR. Zebrafish embryos at one-cell stage were microinjected with plasmids as indicated, followed by extraction of embryonic proteins at the 96-hpf stage. Protein levels of CHOP, p-eIF2α, total eIF2α, Endouc-Flag, and its variants were detected using Western blot analysis. GAPDH served as an internal control. HEK293T cells were transfected with indicated plasmids followed by analysis of the protein levels of CHOP, p-eIF2α, total eIF2α, Endouc-Flag, and its variants using Western blot. The α-tubulin served as an internal control. Protein levels relative to each internal control are presented in each lane. |
|
Schematic representation of zebrafish Endouc protein and its internal deletion mutants.‡ Histograms presented the relative luc activity obtained from zebrafish embryos microinjected simultaneously with puORFchop-luc, phRG-TK, and each one of the expression plasmids as indicated followed by analysis of luc activity at 96 hpf. Embryos microinjected with pCS2 vector during normal condition (non-stress; blank column) served as a control group, while the microinjected embryos treated with 40°C at 72 hpf for 1 h were the heat-shocked group (solid column). The relative luc activity of microinjected embryos shown on the right was normalized by the amount of RNA in the injected embryos shown on the left. The relative luc activity was represented by the fold increase of Fluc/Rluc ratio over that obtained from control group. The luc activity mediated by the huORFchop transcript was measured by dual-luciferase assay, and its corresponding huORFchop-luc transcript was measured by RT–qPCR. Histograms presented the luc activity obtained from HEK293T cells co-transfected with puORFchop-luc, phRG-TK, and each one of the plasmids as indicated; these were treated with either DMSO (control group) or thapsigargin (TH; stress group) followed by analysis of luc activity. The luc activity of cells transfected with pCS2 vector and kept at normal condition served as a control group. The relative luc activity of transfected cells shown on the right was normalized by the amount of RNA in the transfected cells shown on the left. The relative luc activity was represented by the fold increase of Fluc/Rluc ratio over that obtained from pCS2-transfected control group normalized as 1. The luc activity mediated by the huORFchop transcript was measured by the dual-luciferase assay, and its corresponding huORFchop-luc transcript was measured by RT–qPCR. Zebrafish embryos at one-cell stage were microinjected with plasmids as indicated followed by extraction of embryonic proteins at the 96-hpf stage. Protein levels of CHOP, p-eIF2α, total eIF2α, Endouc-Flag, and its variants were detected using Western blot analysis. GAPDH served as an internal control. HEK293T cells were transfected with indicated plasmids followed by analysis of the protein levels of CHOP, p-eIF2α, total eIF2α, Endouc-Flag, and its variants using Western blot. Here, α-tubulin served as an internal control. Protein levels relative to each internal control were presented in each lane. |
|
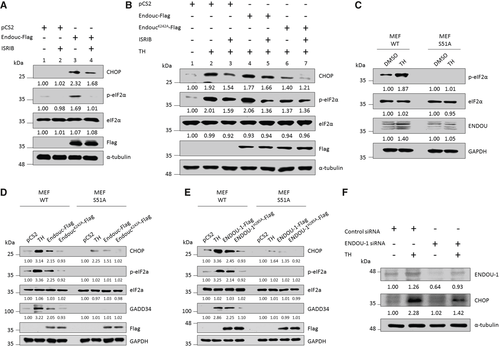
HEK293T cells were transfected with plasmids as indicated for 24 h and treated with DMSO or 200 nM ISRIB for 2 h followed by analysis of the protein level of CHOP, p-eIF2α, total eIF2α, and Endou-Flag using Western blot. The α-tubulin served as an internal control. Protein levels relative to each internal control are presented in each lane. B. HEK293T cells were transfected with plasmids as indicated for 24 h and treated with DMSO, thapsigargin (TH), ISRIB, or TH plus ISRIB for 2 h followed by analysis of the protein level of CHOP, p-eIF2α, total eIF2α, Endouc-Flag, and its variants using Western blot. The α-tubulin served as an internal control. Protein levels relative to each internal control were presented at each lane. C. MEF wild-type (WT) and its eIF2αS51A mutant (S51A) cells were treated with 1 μg of TH for 4 h followed by Western blot analysis of p-eIF2α, total eIF2α, and ENDOU. GAPDH served as an internal control. Protein levels relative to each internal control are presented in each lane. D, E. MEF WT and mutant S51A cells were transfected with plasmids as indicated for 24 h and treated with either DMSO or TH for 4 h followed by analysis of the protein levels of CHOP, p-eIF2α, total eIF2α, GADD34, Endouc-Flag and ENDOU-1-Flag using Western blot. GAPDH served as an internal control. Protein levels relative to each internal control were presented at each lane. F. HEK293T cells were transfected with negative control siRNA and ENDOU-siRNA for 48 h. After treatment, protein lysates were prepared and subjected to Western blot analysis for ENDOU-1 and CHOP detection using antibodies. The α-tubulin served as an internal control. Protein levels relative to each internal control were presented in each lane. |
|
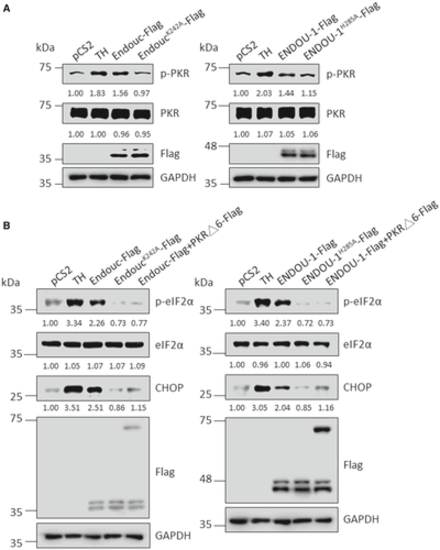
MEF wild-type (WT) cells were transfected with plasmids as indicated for 24 h and treated with either DMSO or thapsigargin (TH) for 4 h followed by analysis of the protein level of p-PKR, total PKR, Endouc-Flag and ENDOU-1-Flag. GAPDH served as an internal control. Protein levels relative to each internal control were presented at each lane. MEF WT cells were transfected with plasmids as indicated for 24 h and treated with either DMSO or TH for 4 h followed by analysis of the protein levels of p-eIF2α, total eIF2α, CHOP, Endouc-Flag and ENDOU-1-Flag. GAPDH served as an internal control. Protein levels relative to each internal control were presented at each lane. The results obtained from the two trials are shown on the left and right. |
|
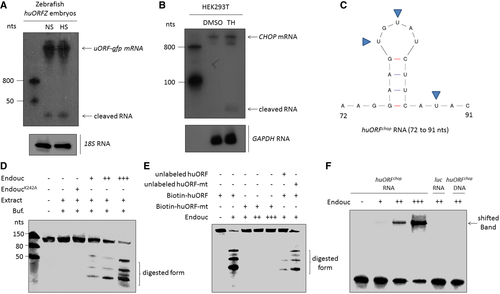
Northern blot analysis to detect the endogenous huORFchop-tagged gfp (uORF-gfp) mRNA and its cleaved form in zebrafish embryos of transgenic line huORFZ treated with non-stress condition (NS) or heat-shocked (HS) stress. Zebrafish 18S rRNA served as an internal control. The RNA fragments cleaved from huORFchop transcript were detected. B. Northern blot analysis to detect endogenous CHOP mRNA in HEK293T cells treated with either DMSO (control group) or thapsigargin (TH). Human GAPDH RNA served as internal control. The RNA fragments cleaved from CHOP mRNA were detected. C. The predicted RNA sequences of Endouc recognition site on huORFchop transcript from 72 to 91 nts are illustrated. The predicted cleavage sites at uridylates (U) are indicated by arrowheads. D, E. The cleavage activity of Endouc was studied using materials presented at each lane. EndoucK242A: Endouc mutant; Extract: incubated in cell extracts; and Buf: reaction buffer. RNA probe without adding reaction buffer served as a negative control. The predicted cleavage sites (U) were mutated to generate mutant huORFchop transcript (unlabeled huORF-mt) and labeled by biotin (biotin-huORF-mt). Unlabeled competitor RNA was added in reactions at five times higher than that of the biotinylated probe. F. Electrophoretic mobility shifted assay of RNA. Biotin-labeled huORFchop transcript was reacted with the increased amount of Endouc. The positions of free RNA (free probe) and RNA–protein complex (shifted band) were indicated on the right. The luc 105-nt RNA and single-stranded huORFchop 105-nt DNA served as negative controls. |
|
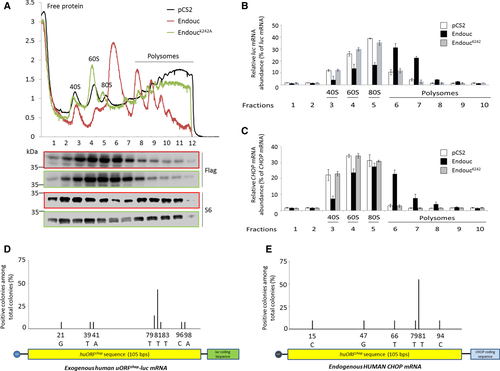
HEK293T cells were transfected with pCS2 vector (black), pCS2-Endouc (red), and pCS2-EndoucK242A (green) for 24 h and subjected to either DMSO (control) or thapsigargin (TH; stress) treatment for 1 h. The lysates of transfected cells were applied to polysome profile analysis (PPA). The sucrose gradient from top to bottom was shown from left to right, respectively. The sedimentation of 40S, 60S, 80S, and polysomes was indicated. Lysates from control, Endouc-expressing, and EndoucK242A-expressing cells were applied to PPA. The resulting fractions were TCA-precipitated, analyzed by SDS–PAGE, and subjected to Western blot using antibodies against Flag and S6. Upper and lower rows of Flag- and S6 blots were Endouc- and EndoucK242A- expressing cells, respectively. B, C. The lysates from control (pCS2), Endouc-expressing (Endouc), and EndoucK242A-expressing (EndoucK242A) cells were applied to PPA. The resulting fractions from 1-10 collected from sucrose gradient were subsequently subjected to RT–qPCR assay to quantify (B) exogenous huORFchop-tagged luc (luc mRNA) and (C) endogenous CHOP transcripts (CHOP mRNA). The distribution of relative abundance of luc and CHOP transcripts contained in each fraction was determined. D, E. HEK293T cells were co-transfected with pCS2-Endouc and phuORFchop-luc for 24 h and then subjected to DMSO or TH treatment for 2 h. The lysates of transfected cells were then applied to PPA. Total RNAs were isolated from heavy polysome fractions followed by performing 5′RACE to characterize the nucleotide sequences of truncated (D) exogenous huORFchop-luc and (E) endogenous huORFchop-CHOP transcripts. The first sequence at N-terminus of RNA samples from the truncated forms derived from exogenous huORFchop-luc (n = 14) and endogenous huORFchop-CHOP transcripts (n = 11) was determined; the percentages of positive colonies containing various 5′UTR lengths (truncated forms) of luc and CHOP transcripts among total colonies examined were calculated. |
|
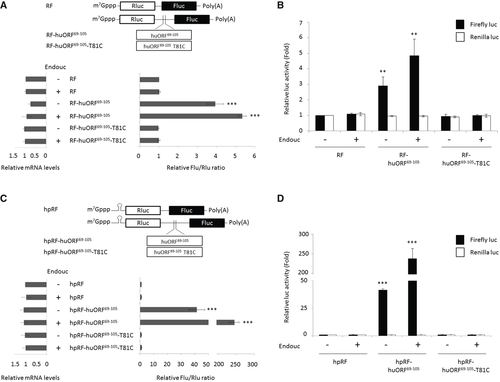
Schematic representation of RF bicistronic transcript is shown above the bar graphs. Rluc: Renilla luciferase (blank box); Fluc: Firefly luciferase (solid box). The luc activity of HEK293T cells transfected with bicistronic mRNA, as indicated, in the presence (+) or absence (−) of endouc-Flag mRNA was determined. The relative luc activity of transfected cells shown on the right was normalized by the amount of the transfected bicistronic transcript shown on the left. The relative luc activity was represented by the fold increase of Fluc/Rluc ratio over that obtained from control group, normalized as 1. The luc activity was measured by dual-luciferase assay, and its corresponding bicistronic mRNAs were measured by RT–qPCR. The values were calculated from three independent experiments and presented as mean ± SD (n = 3). Student's t-test was used to determine significant differences between each group (***P < 0.001). The luc activity of Fluc (solid column) versus Rluc (blank column) in HEK293T cells transfected with bicistronic mRNAs shown in A was presented as an increase in fold over that obtained from control group of RF which was normalized as 1. These data suggested that the change of Fluc/Rluc ratio shown in A was entirely dependent on the change of Fluc activity. The data were averaged from three independent experiments and presented as mean ± SD (n = 3). Student's t-test was used to determine significant differences between each group (**P < 0.005). Schematic representation of hpRF bicistronic transcript. Rluc: Renilla luciferase (blank box); Fluc: Firefly luciferase (solid box). The luc activity of HEK293T cells transfected with bicistronic mRNA, as indicated, in the presence (+) or absence (−) of endouc-Flag mRNA was determined. The relative luc activity of transfected cells shown on the right was normalized by the amount of the transfected bicistronic transcript shown on the left. The relative luc activity was represented by the fold increase of Fluc/Rluc ratio over that obtained from control group, normalized as 1. The luc activity was measured by dual-luciferase assay, and its corresponding bicistronic mRNAs were measured by RT–qPCR. The values were calculated from three independent experiments and presented as mean ± SD (n = 3). Student's t-test was used to determine significant differences between each group (***P < 0.001). The luc activity of Fluc (solid column) versus Rluc (blank column) in HEK293T cells transfected with bicistronic mRNAs shown in C was presented as an increase in fold over that obtained from control group of hpRF which was normalized as 1. These data suggested that the change of Fluc/Rluc ratio shown in C was entirely dependent on the change of Fluc activity. The data were averaged from three independent experiments and presented as mean ± SD (n = 3). Student's t-test was used to determine significant differences between each group (***P < 0.001). |
|
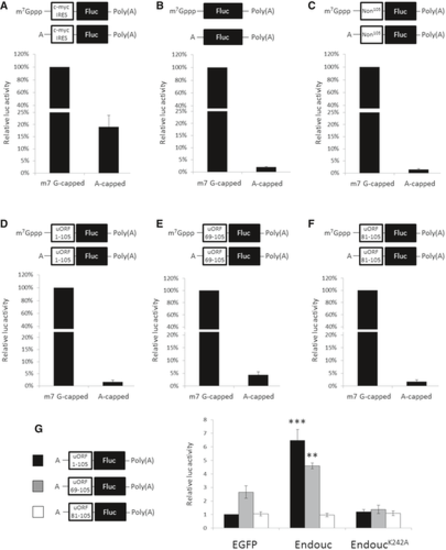
A–F. Schematic representation of capped (m7G-capped) and A-capped (non-functional capped) monocistronic mRNAs with poly(A)-tail-encoded firefly luciferase (Fluc) and fused upstream with (A) c-myc IRES, (B) no insertion, (C) non-specific 105-nt luc RNA (Non105), (D) huORFchop-1-105-nt, (E) huORFchop-69-105-nt, and (F) huORFchop-81-105-nt as shown above each bar graph. The RNA transfection assay of each transcript equipped with m7G-capped or A-capped monocistronic mRNA in HEK293T cells was compared. To normalize the luc activities of capped and A-capped Fluc transcripts, the m7G-capped Renilla luc (Rluc) mRNA was used as an internal control. The luc activity of cells transfected with cap-monocistronic mRNA in each graph was set as 100%. G. The luc activity driven by the indicated A-capped monocistronic mRNA in the presence of Endouc or EndoucK242A in HEK293T cells. The m7G-capped Rluc mRNA was used as an internal control to normalize the activities of A-cap Fluc transcripts. The egfp mRNA was used as a negative control, and the luc activity of cells transfected with egfp mRNA and A-cap Fluc mRNA containing full-length huORFchop-1-105-nt was set to 1. The data were averaged from three independent experiments and presented as mean ± SD (n = 3). Student's t-test was used to determine significant differences between each group (**P < 0.005, ***P < 0.001). |
|
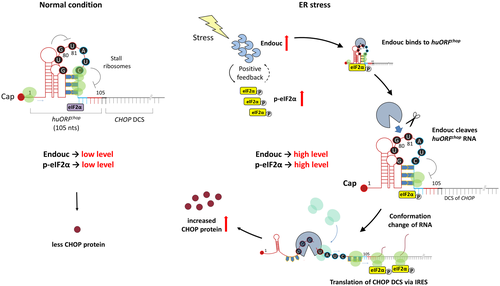
During normal conditions, the translation of CHOP protein is blocked by huORFchop-TI due to ribosomes stalled at 81–90 nts within the 105-nt huORFchop transcript. However, Endouc/ENDOU is quickly produced when cells encounter environmental stress, e.g., heat-shock and hypoxia as in the present work. It binds to the hairpin structure of huORFchop transcript formed at 72–91 nts and cleaves it at the 80G-81U site. This endonuclease activity changes the conformation of inhibitory structure formed by huORFchop transcript, in turn, releasing the stalled ribosomes to scan through the huORFchop transcript and reinitiate at AUG of the main downstream coding sequence (DCS) of huORFchop transcript. Finally, CHOP transcript is continuously translated via the IRES activity driven by huORFchop−69-105-nt and the increase of p-eIF2α induced by Endouc/ENDOU. |

