
Fig. 9
- ID
- ZDB-FIG-211102-23
- Publication
- Lee et al., 2021 - Poly(U)-specific endoribonuclease ENDOU promotes translation of human CHOP mRNA by releasing uORF element-mediated inhibition
- Other Figures
- All Figure Page
- Back to All Figure Page
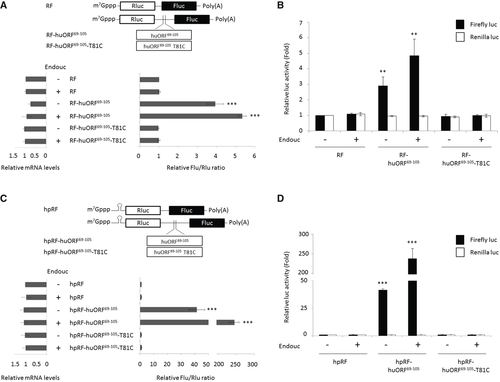
Schematic representation of RF bicistronic transcript is shown above the bar graphs. Rluc: Renilla luciferase (blank box); Fluc: Firefly luciferase (solid box). The luc activity of HEK293T cells transfected with bicistronic mRNA, as indicated, in the presence (+) or absence (−) of endouc-Flag mRNA was determined. The relative luc activity of transfected cells shown on the right was normalized by the amount of the transfected bicistronic transcript shown on the left. The relative luc activity was represented by the fold increase of Fluc/Rluc ratio over that obtained from control group, normalized as 1. The luc activity was measured by dual-luciferase assay, and its corresponding bicistronic mRNAs were measured by RT–qPCR. The values were calculated from three independent experiments and presented as mean ± SD (n = 3). Student's t-test was used to determine significant differences between each group (***P < 0.001). The luc activity of Fluc (solid column) versus Rluc (blank column) in HEK293T cells transfected with bicistronic mRNAs shown in A was presented as an increase in fold over that obtained from control group of RF which was normalized as 1. These data suggested that the change of Fluc/Rluc ratio shown in A was entirely dependent on the change of Fluc activity. The data were averaged from three independent experiments and presented as mean ± SD (n = 3). Student's t-test was used to determine significant differences between each group (**P < 0.005). Schematic representation of hpRF bicistronic transcript. Rluc: Renilla luciferase (blank box); Fluc: Firefly luciferase (solid box). The luc activity of HEK293T cells transfected with bicistronic mRNA, as indicated, in the presence (+) or absence (−) of endouc-Flag mRNA was determined. The relative luc activity of transfected cells shown on the right was normalized by the amount of the transfected bicistronic transcript shown on the left. The relative luc activity was represented by the fold increase of Fluc/Rluc ratio over that obtained from control group, normalized as 1. The luc activity was measured by dual-luciferase assay, and its corresponding bicistronic mRNAs were measured by RT–qPCR. The values were calculated from three independent experiments and presented as mean ± SD (n = 3). Student's t-test was used to determine significant differences between each group (***P < 0.001). The luc activity of Fluc (solid column) versus Rluc (blank column) in HEK293T cells transfected with bicistronic mRNAs shown in C was presented as an increase in fold over that obtained from control group of hpRF which was normalized as 1. These data suggested that the change of Fluc/Rluc ratio shown in C was entirely dependent on the change of Fluc activity. The data were averaged from three independent experiments and presented as mean ± SD (n = 3). Student's t-test was used to determine significant differences between each group (***P < 0.001). |