
Fig. 2
- ID
- ZDB-FIG-211102-16
- Publication
- Lee et al., 2021 - Poly(U)-specific endoribonuclease ENDOU promotes translation of human CHOP mRNA by releasing uORF element-mediated inhibition
- Other Figures
- All Figure Page
- Back to All Figure Page
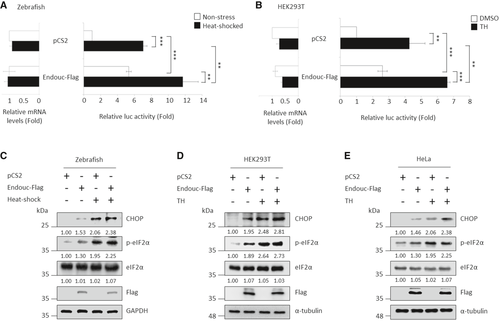
Histograms show the luc activity obtained from zebrafish embryos microinjected simultaneously with puORFchop-luc, phRG-TK, and each indicated plasmid followed by analysis of luc activity at 96 hpf. Embryos microinjected with pCS2 vector during normal condition (non-stress; blank column) served as a control group, while the microinjected embryos treated with 40°C at 72 hpf for 1 h were the heat-shocked group (solid column). The relative luc activity of microinjected embryos shown on the right was normalized by the amount of RNA in the injected embryos shown on the left. The relative luc activity was represented by the fold increase of Fluc/Rluc ratio over that obtained from the control group (this was normalized to 1). The luc activity mediated by the huORFchop transcript was measured by dual-luciferase assay, and its corresponding huORFchop-luc transcript was measured by RT–qPCR. Values representing the non-stress and stress condition were calculated from three independent experiments and presented as mean ± SD (n = 3). Student's t-test was used to determine significant differences between each group (**P < 0.005, ***P < 0.001). B. Histograms present the luc activity obtained from HEK293T cells co-transfected with puORFchop-luc, phRG-TK, and each indicated plasmid and then treated with either DMSO (control group) or thapsigargin (TH; stress group), followed by analysis of luc activity. Cells transfected with pCS2-vector and kept at normal condition served as a control group. The relative luc activity of transfected cells shown on the right was normalized by the amount of mRNA in the transfected cells shown on the left. The relative luc activity was represented by the fold increase of Fluc/Rluc ratio over that obtained from pCS2-transfected control group (this was normalized to 1). The luc activity mediated by the huORFchop transcript was measured by dual-luciferase assay, and its corresponding huORFchop-luc transcript was measured by RT–qPCR. Values representing the non-stress and stress conditions were calculated from three independent experiments and presented as mean ± SD (n = 3). Student's t-test was used to determine significant differences between each group (**P < 0.005, ***P < 0.001). C–E. Western blot analysis of proteins, as indicated, in (C) zebrafish embryos, (D) HEK293T cells and (E) HeLa cells. GAPDH and α-tubulin served as internal controls. Protein levels relative to each internal control are presented below each lane. |