
|
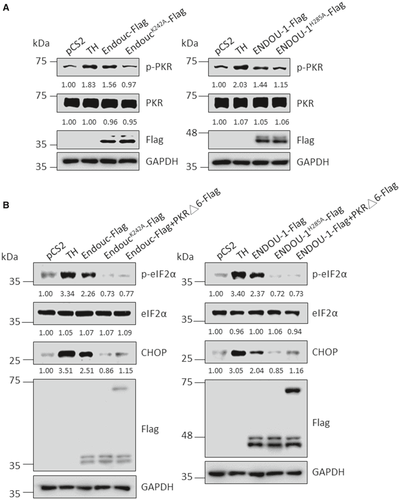
Fig. 6 MEF wild-type (WT) cells were transfected with plasmids as indicated for 24 h and treated with either DMSO or thapsigargin (TH) for 4 h followed by analysis of the protein level of p-PKR, total PKR, Endouc-Flag and ENDOU-1-Flag. GAPDH served as an internal control. Protein levels relative to each internal control were presented at each lane. MEF WT cells were transfected with plasmids as indicated for 24 h and treated with either DMSO or TH for 4 h followed by analysis of the protein levels of p-eIF2α, total eIF2α, CHOP, Endouc-Flag and ENDOU-1-Flag. GAPDH served as an internal control. Protein levels relative to each internal control were presented at each lane. The results obtained from the two trials are shown on the left and right.