
|
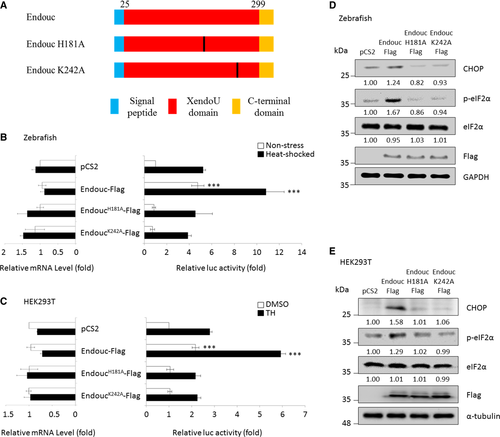
Fig. 4 Schematic representation of zebrafish Endouc protein and its internal deletion mutants.‡ Histograms presented the relative luc activity obtained from zebrafish embryos microinjected simultaneously with puORFchop-luc, phRG-TK, and each one of the expression plasmids as indicated followed by analysis of luc activity at 96 hpf. Embryos microinjected with pCS2 vector during normal condition (non-stress; blank column) served as a control group, while the microinjected embryos treated with 40°C at 72 hpf for 1 h were the heat-shocked group (solid column). The relative luc activity of microinjected embryos shown on the right was normalized by the amount of RNA in the injected embryos shown on the left. The relative luc activity was represented by the fold increase of Fluc/Rluc ratio over that obtained from control group. The luc activity mediated by the huORFchop transcript was measured by dual-luciferase assay, and its corresponding huORFchop-luc transcript was measured by RT–qPCR. Histograms presented the luc activity obtained from HEK293T cells co-transfected with puORFchop-luc, phRG-TK, and each one of the plasmids as indicated; these were treated with either DMSO (control group) or thapsigargin (TH; stress group) followed by analysis of luc activity. The luc activity of cells transfected with pCS2 vector and kept at normal condition served as a control group. The relative luc activity of transfected cells shown on the right was normalized by the amount of RNA in the transfected cells shown on the left. The relative luc activity was represented by the fold increase of Fluc/Rluc ratio over that obtained from pCS2-transfected control group normalized as 1. The luc activity mediated by the huORFchop transcript was measured by the dual-luciferase assay, and its corresponding huORFchop-luc transcript was measured by RT–qPCR. Zebrafish embryos at one-cell stage were microinjected with plasmids as indicated followed by extraction of embryonic proteins at the 96-hpf stage. Protein levels of CHOP, p-eIF2α, total eIF2α, Endouc-Flag, and its variants were detected using Western blot analysis. GAPDH served as an internal control. HEK293T cells were transfected with indicated plasmids followed by analysis of the protein levels of CHOP, p-eIF2α, total eIF2α, Endouc-Flag, and its variants using Western blot. Here, α-tubulin served as an internal control. Protein levels relative to each internal control were presented in each lane.