
|
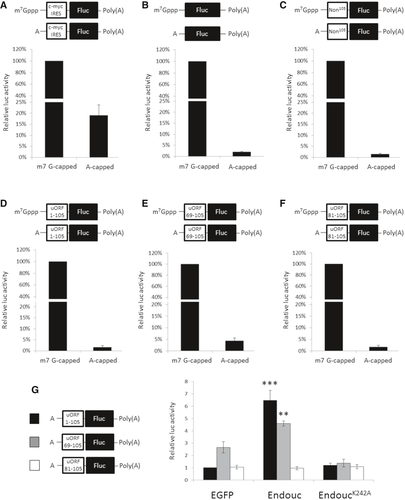
Fig. 10 A–F. Schematic representation of capped (m7G-capped) and A-capped (non-functional capped) monocistronic mRNAs with poly(A)-tail-encoded firefly luciferase (Fluc) and fused upstream with (A) c-myc IRES, (B) no insertion, (C) non-specific 105-nt luc RNA (Non105), (D) huORFchop-1-105-nt, (E) huORFchop-69-105-nt, and (F) huORFchop-81-105-nt as shown above each bar graph. The RNA transfection assay of each transcript equipped with m7G-capped or A-capped monocistronic mRNA in HEK293T cells was compared. To normalize the luc activities of capped and A-capped Fluc transcripts, the m7G-capped Renilla luc (Rluc) mRNA was used as an internal control. The luc activity of cells transfected with cap-monocistronic mRNA in each graph was set as 100%. G. The luc activity driven by the indicated A-capped monocistronic mRNA in the presence of Endouc or EndoucK242A in HEK293T cells. The m7G-capped Rluc mRNA was used as an internal control to normalize the activities of A-cap Fluc transcripts. The egfp mRNA was used as a negative control, and the luc activity of cells transfected with egfp mRNA and A-cap Fluc mRNA containing full-length huORFchop-1-105-nt was set to 1. The data were averaged from three independent experiments and presented as mean ± SD (n = 3). Student's t-test was used to determine significant differences between each group (**P < 0.005, ***P < 0.001).