- Title
-
Larval Zebrafish Use Olfactory Detection of Sodium and Chloride to Avoid Salt Water
- Authors
- Herrera, K.J., Panier, T., Guggiana-Nilo, D., Engert, F.
- Source
- Full text @ Curr. Biol.
|
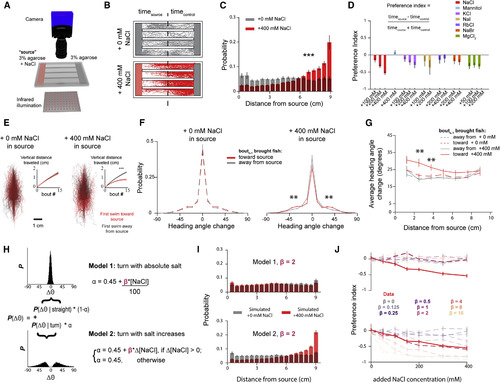
(A) Schematic of the rig used to perform chemical place preference assays. (B) Sample experiments when 0 mM (top) or 400 mM (bottom) are added to the source agarose. Individual dots demarcate position of larvae at every 50th frame spanning the entire experiment. (C) Histogram of positional occupancy over the entire experiment by larvae when the source gel contains either 0 mM (n = 30) or 400 mM NaCl (n = 24) added (Mann-Whitney U test; p < 0.001) (error bars: mean ± SEM across fish). (D) Preference indices toward different chemical solutions (error bars: mean ± SEM). (E) Individual trajectories of 15 bouts that follow a bout that climbs (red) or descends (gray) gradients with 0 (left) and 400 mM (right) NaCl added to the source. Inset depicts average accumulated distance along the gradient axis in the direction of the first bout (two-sided t test; p < 0.001 for total distance when 400 mM in source; shading indicates SEM). (F) Average turn angle as the larvae swims toward or away from the source as a function of their position in the arena (error bars: mean ± SEM; Bonferroni-corrected t test; p < 0.01). (G) Difference in average turn angle of bouts that follow an increased salt concentration compared to those that follow a decreased salt concentration for different concentrations of source salt (error bars: mean ± SEM; Bonferroni-corrected t test; p < 0.01). (H) Description of the two models being simulated: larvae respond to absolute (model 1) or relative (model 2) salt concentrations. (I) Spatial distribution of larvae in a simulated linear salt gradient when model 1 (top) or model 2 (bottom) are active (error bars: mean ± SEM). (J) Preference indices toward different concentrations of NaCl that result from simulating fish according to both algorithms for a range of salt sensitivities (β) (error bars: mean ± SEM). |
|
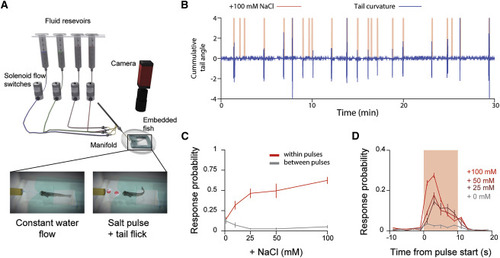
(A) Schematic of preparation used to stimulate head-embedded larvae. (B) Sample data from an experiment where a larva is stimulated with 10-s pulses of 100 mM NaCl at random intervals. (C) Probability that the larva will exhibit a behavioral response to a pulse of a given NaCl concentration (red) and inter-pulse spontaneous behavior rate (gray) to flowing fish water (error bars: mean ± SEM across fish). (D) Probability of a bout event occurring within 2-s bins for different concentrations of salt relative to the onset of a pulse (error bars: mean ± SEM across fish). |
|
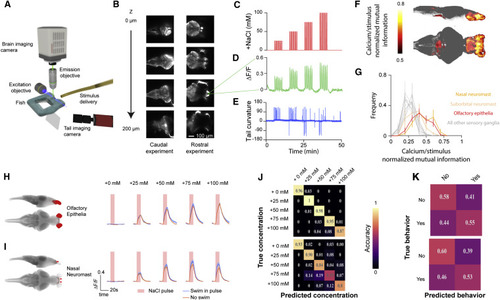
(A) Schematic of the light-sheet microscope. (B) Sample z-slices taken within a stack of a huc:GCaMP6S transgenic larvae. Stacks were collected at 1 Hz. Imaging experiments captured either the rostral 2/3rds or caudal 2/3rds of the fish. (C) Arrangement of salt pulses during each experiment. Zebrafish experienced escalating concentrations of NaCl pulses in 5-min blocks. (D) Example calcium signal from an activity unit in the olfactory bulb. (E) Example tail curvature trace during imaging experiment. (F) Average stimulus correlation at each voxel of the Z-brain across 15 fish. (G) Histogram of normalized mutual information in units from each of the sensory ganglia in the Z-brain (error bars: mean ± SEM across fish). (H) Stimulus-triggered responses of top NaCl encoding units from the olfactory epithelia, averaged across fish, and their locations within the Z-brain. Responses are separated into trials where the fish swam (blue) or did not swim (purple). Mean ± SEM across fish. (I) Stimulus-triggered responses of top NaCl encoding units in the nasal neuromast averaged across fish as in (H). (J) Confusion matrices depicting stimulus classification accuracy of support vector machines trained from activity in the olfactory epithelia (top) and nasal neuromast (bottom). (K) Confusion matrices depicting behavioral response classification accuracy of support vector machines trained from activity in the olfactory epithelia (top) and nasal neuromast (bottom). |
|
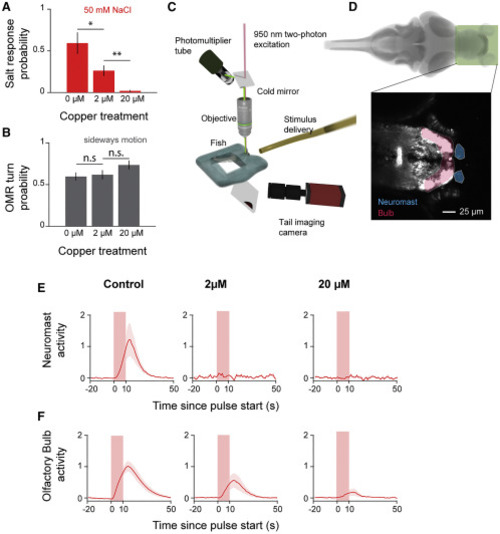
(A) Behavioral response probability of tail-embedded larvae to 50 mM NaCl after incubation in different concentrations of copper (two-sided t test; p = 0.034 and p = 0.0039; error bars: mean ± SEM across fish; n=6 each). (B) Behavioral response probability of tail-embedded larvae to whole-field motion after incubation in different concentrations of copper (two-sided t test; p = 0.77 and p = 0.13; error bars: mean ± SEM across fish; n = 15 each). (C) Schematic depicting the two-photon microscope setup used to image the olfactory bulb and epithelia. (D) Region of the brain imaged in this figure. Zoom depicts sample slices averaged over time. Shadings indicate segmented regions—neuromast (orange) and olfactory bulb (red). (E) Stimulus-triggered averages (shading indicates SEM) of neuromast calcium activity during 50-mM NaCl pulses. For fish where neuromasts are fully removed, masks are drawn around where they would normally be. (F) Stimulus-triggered averages (shading indicates SEM) of olfactory bulb calcium activity during 50-mM NaCl pulses. |
|
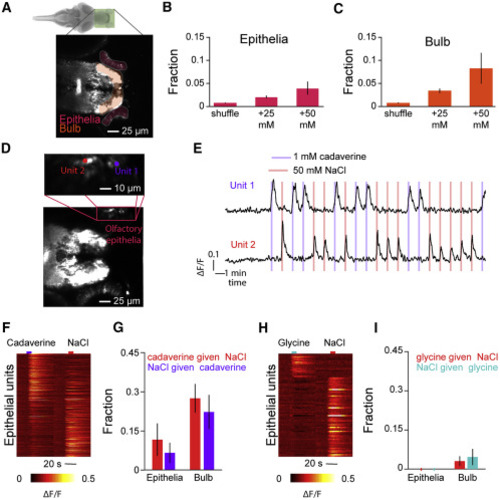
(A) Plane from the imaged region. Shadings indicate segmented regions—olfactory bulb (orange) and epithelia (red). (B) Average fraction of active units in the olfactory epithelia of huc:GCaMP6s-positive fish during 25-mM or 50-mM pulses and after applying the same criteria to shuffled traces (error bars indicate SEM across fish; n = 3 fish). (C) Average fraction of active units in the olfactory bulb of huc:GCaMP6s-positive fish during 25-mM or 50-mM pulses and after applying the same criteria to shuffled traces (error bars indicate SEM across fish; n = 3 fish). (D) Projection across time of a sample slice imaged with 1 mM cadaverine and 50 mM NaCl. Inset depicts the location of two sample units from within the olfactory epithelia. (E) Calcium traces of the two units depicted in (F) in response to 10-s pulses of 1 mM cadaverine or 50 mM NaCl. (F) Heatmap depicting stimulus-triggered average activity of all responsive epithelial units to cadaverine and NaCl. (G) Fraction of units that are responsive to NaCl that are also responsive to cadaverine and vice versa (error bars indicate SEM across fish; n = 3 fish). (H) Heatmap depicting stimulus-triggered average activity of all responsive epithelial units to glycine and NaCl. (I) Fraction of units that are responsive to NaCl that are also responsive to glycine and vice versa (error bars indicate SEM across fish; n = 3 fish). |
|
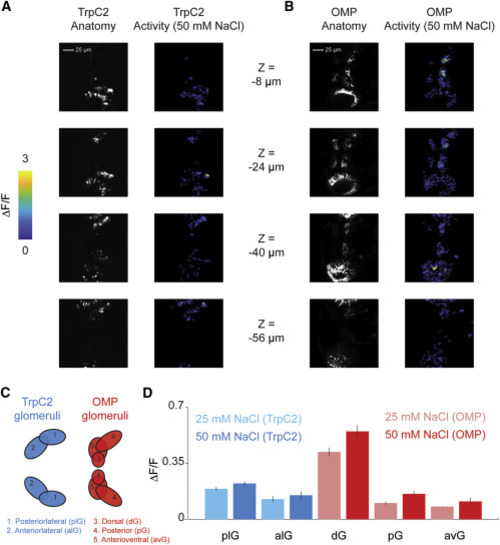
(A) Sample slices from a stack taken during imaging trpc2:Gal4;uas:GCaMP6s. Left column images are maximum intensity projects, although the right column shows average maximal activity (ΔF/F) during a 50 mM NaCl trial. (B) Sample slices from a stack taken during imaging omp:Gal4;uas:GCaMP6s. Left column images are maximum intensity projects, although the right column shows average maximal activity during a 50 mM NaCl trial. (C) Schematic depicting anatomical locations of glomeruli in omp and trpc2 fish used to generate (D). (D) Average across trials, cells, and fish (error bars: SEM across fish; n = 3) of the maximum activity elicited by 25 mM NaCl or 50 mM NaCl within each of the glomeruli defined in (C). |
|
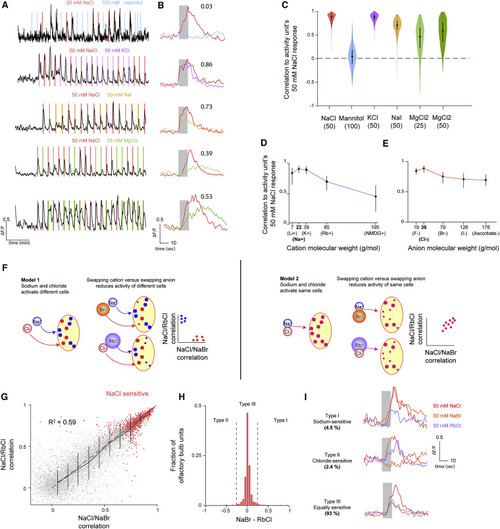
(A) Sample activity trace from an olfactory bulb unit while the fish is stimulated with pulses of 50 mM NaCl and a test chemical. (B) Stimulus-triggered averages of the activity unit in (A) in response to 50 mM NaCl and a test chemical. For each unit examined, the correlation between the NaCl-triggered response and test-triggered response is reported (i.e., 0.03 for the sample mannitol unit). These values correspond roughly to the medians of the distributions in (C). (C) Distribution of the correlation of each olfactory bulb activity unit’s NaCl response to different chemicals. Bars in violin plots indicate median ± 25%. (D) Median (error bars 25%–75%) correlation of NaCl activity with different cation/chloride combinations. (E) Median (error bars 25%–75%) correlation of NaCl activity with different anion/sodium combinations. (F) Cartoon depicting the two models of NaCl sensitivity and expected results from stimulating NaCl-sensitive cells with NaBr and RbCl given each model. (G) Scatterplot of correlation between NaCl and RbCl responses versus correlation between NaCl and NaBr responses for each activity unit tested (indicated by gray dots; n = 3 fish). R-squared calculated from the correlation of all individual units from within the three olfactory bulbs. Solid line indicates average and variance of NaCl/RbCl correlation for binned NaCl/NaBr correlations. Error bars indicate variance of RbCl correlations for a given NaBr bin. Dashed line indicates unity. Red dots indicate units judged as NaCl sensitive (inter-trial correlation >0.8). (H) Histogram of NaCl-sensitive cells in (G) of the difference between NaCl/NaBr correlation and NaCl/RbCl correlation. Dashed lines indicate cutoff separating chloride sensitive (<−0.25), equal sensitive, and sodium sensitive (>0.25). (I) Sample stimulus-triggered averages of cells from each type for NaCl, NaBr, and RbCl. |

