
Fig. 4
- ID
- ZDB-FIG-210330-4
- Publication
- Herrera et al., 2020 - Larval Zebrafish Use Olfactory Detection of Sodium and Chloride to Avoid Salt Water
- Other Figures
- All Figure Page
- Back to All Figure Page
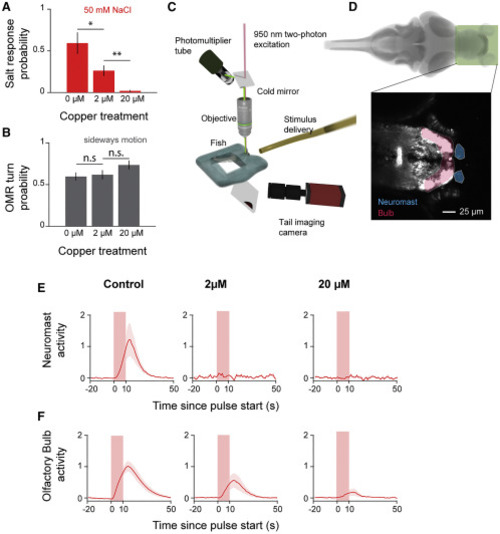
(A) Behavioral response probability of tail-embedded larvae to 50 mM NaCl after incubation in different concentrations of copper (two-sided t test; p = 0.034 and p = 0.0039; error bars: mean ± SEM across fish; n=6 each). (B) Behavioral response probability of tail-embedded larvae to whole-field motion after incubation in different concentrations of copper (two-sided t test; p = 0.77 and p = 0.13; error bars: mean ± SEM across fish; n = 15 each). (C) Schematic depicting the two-photon microscope setup used to image the olfactory bulb and epithelia. (D) Region of the brain imaged in this figure. Zoom depicts sample slices averaged over time. Shadings indicate segmented regions—neuromast (orange) and olfactory bulb (red). (E) Stimulus-triggered averages (shading indicates SEM) of neuromast calcium activity during 50-mM NaCl pulses. For fish where neuromasts are fully removed, masks are drawn around where they would normally be. (F) Stimulus-triggered averages (shading indicates SEM) of olfactory bulb calcium activity during 50-mM NaCl pulses. |