
Fig. 7
- ID
- ZDB-FIG-210330-7
- Publication
- Herrera et al., 2020 - Larval Zebrafish Use Olfactory Detection of Sodium and Chloride to Avoid Salt Water
- Other Figures
- All Figure Page
- Back to All Figure Page
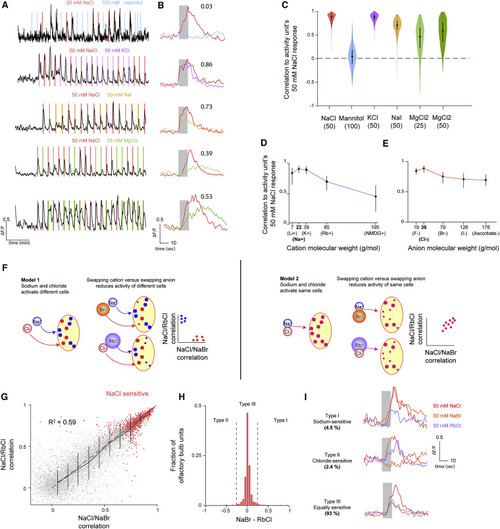
(A) Sample activity trace from an olfactory bulb unit while the fish is stimulated with pulses of 50 mM NaCl and a test chemical. (B) Stimulus-triggered averages of the activity unit in (A) in response to 50 mM NaCl and a test chemical. For each unit examined, the correlation between the NaCl-triggered response and test-triggered response is reported (i.e., 0.03 for the sample mannitol unit). These values correspond roughly to the medians of the distributions in (C). (C) Distribution of the correlation of each olfactory bulb activity unit’s NaCl response to different chemicals. Bars in violin plots indicate median ± 25%. (D) Median (error bars 25%–75%) correlation of NaCl activity with different cation/chloride combinations. (E) Median (error bars 25%–75%) correlation of NaCl activity with different anion/sodium combinations. (F) Cartoon depicting the two models of NaCl sensitivity and expected results from stimulating NaCl-sensitive cells with NaBr and RbCl given each model. (G) Scatterplot of correlation between NaCl and RbCl responses versus correlation between NaCl and NaBr responses for each activity unit tested (indicated by gray dots; n = 3 fish). R-squared calculated from the correlation of all individual units from within the three olfactory bulbs. Solid line indicates average and variance of NaCl/RbCl correlation for binned NaCl/NaBr correlations. Error bars indicate variance of RbCl correlations for a given NaBr bin. Dashed line indicates unity. Red dots indicate units judged as NaCl sensitive (inter-trial correlation >0.8). (H) Histogram of NaCl-sensitive cells in (G) of the difference between NaCl/NaBr correlation and NaCl/RbCl correlation. Dashed lines indicate cutoff separating chloride sensitive (<−0.25), equal sensitive, and sodium sensitive (>0.25). (I) Sample stimulus-triggered averages of cells from each type for NaCl, NaBr, and RbCl. |