
|
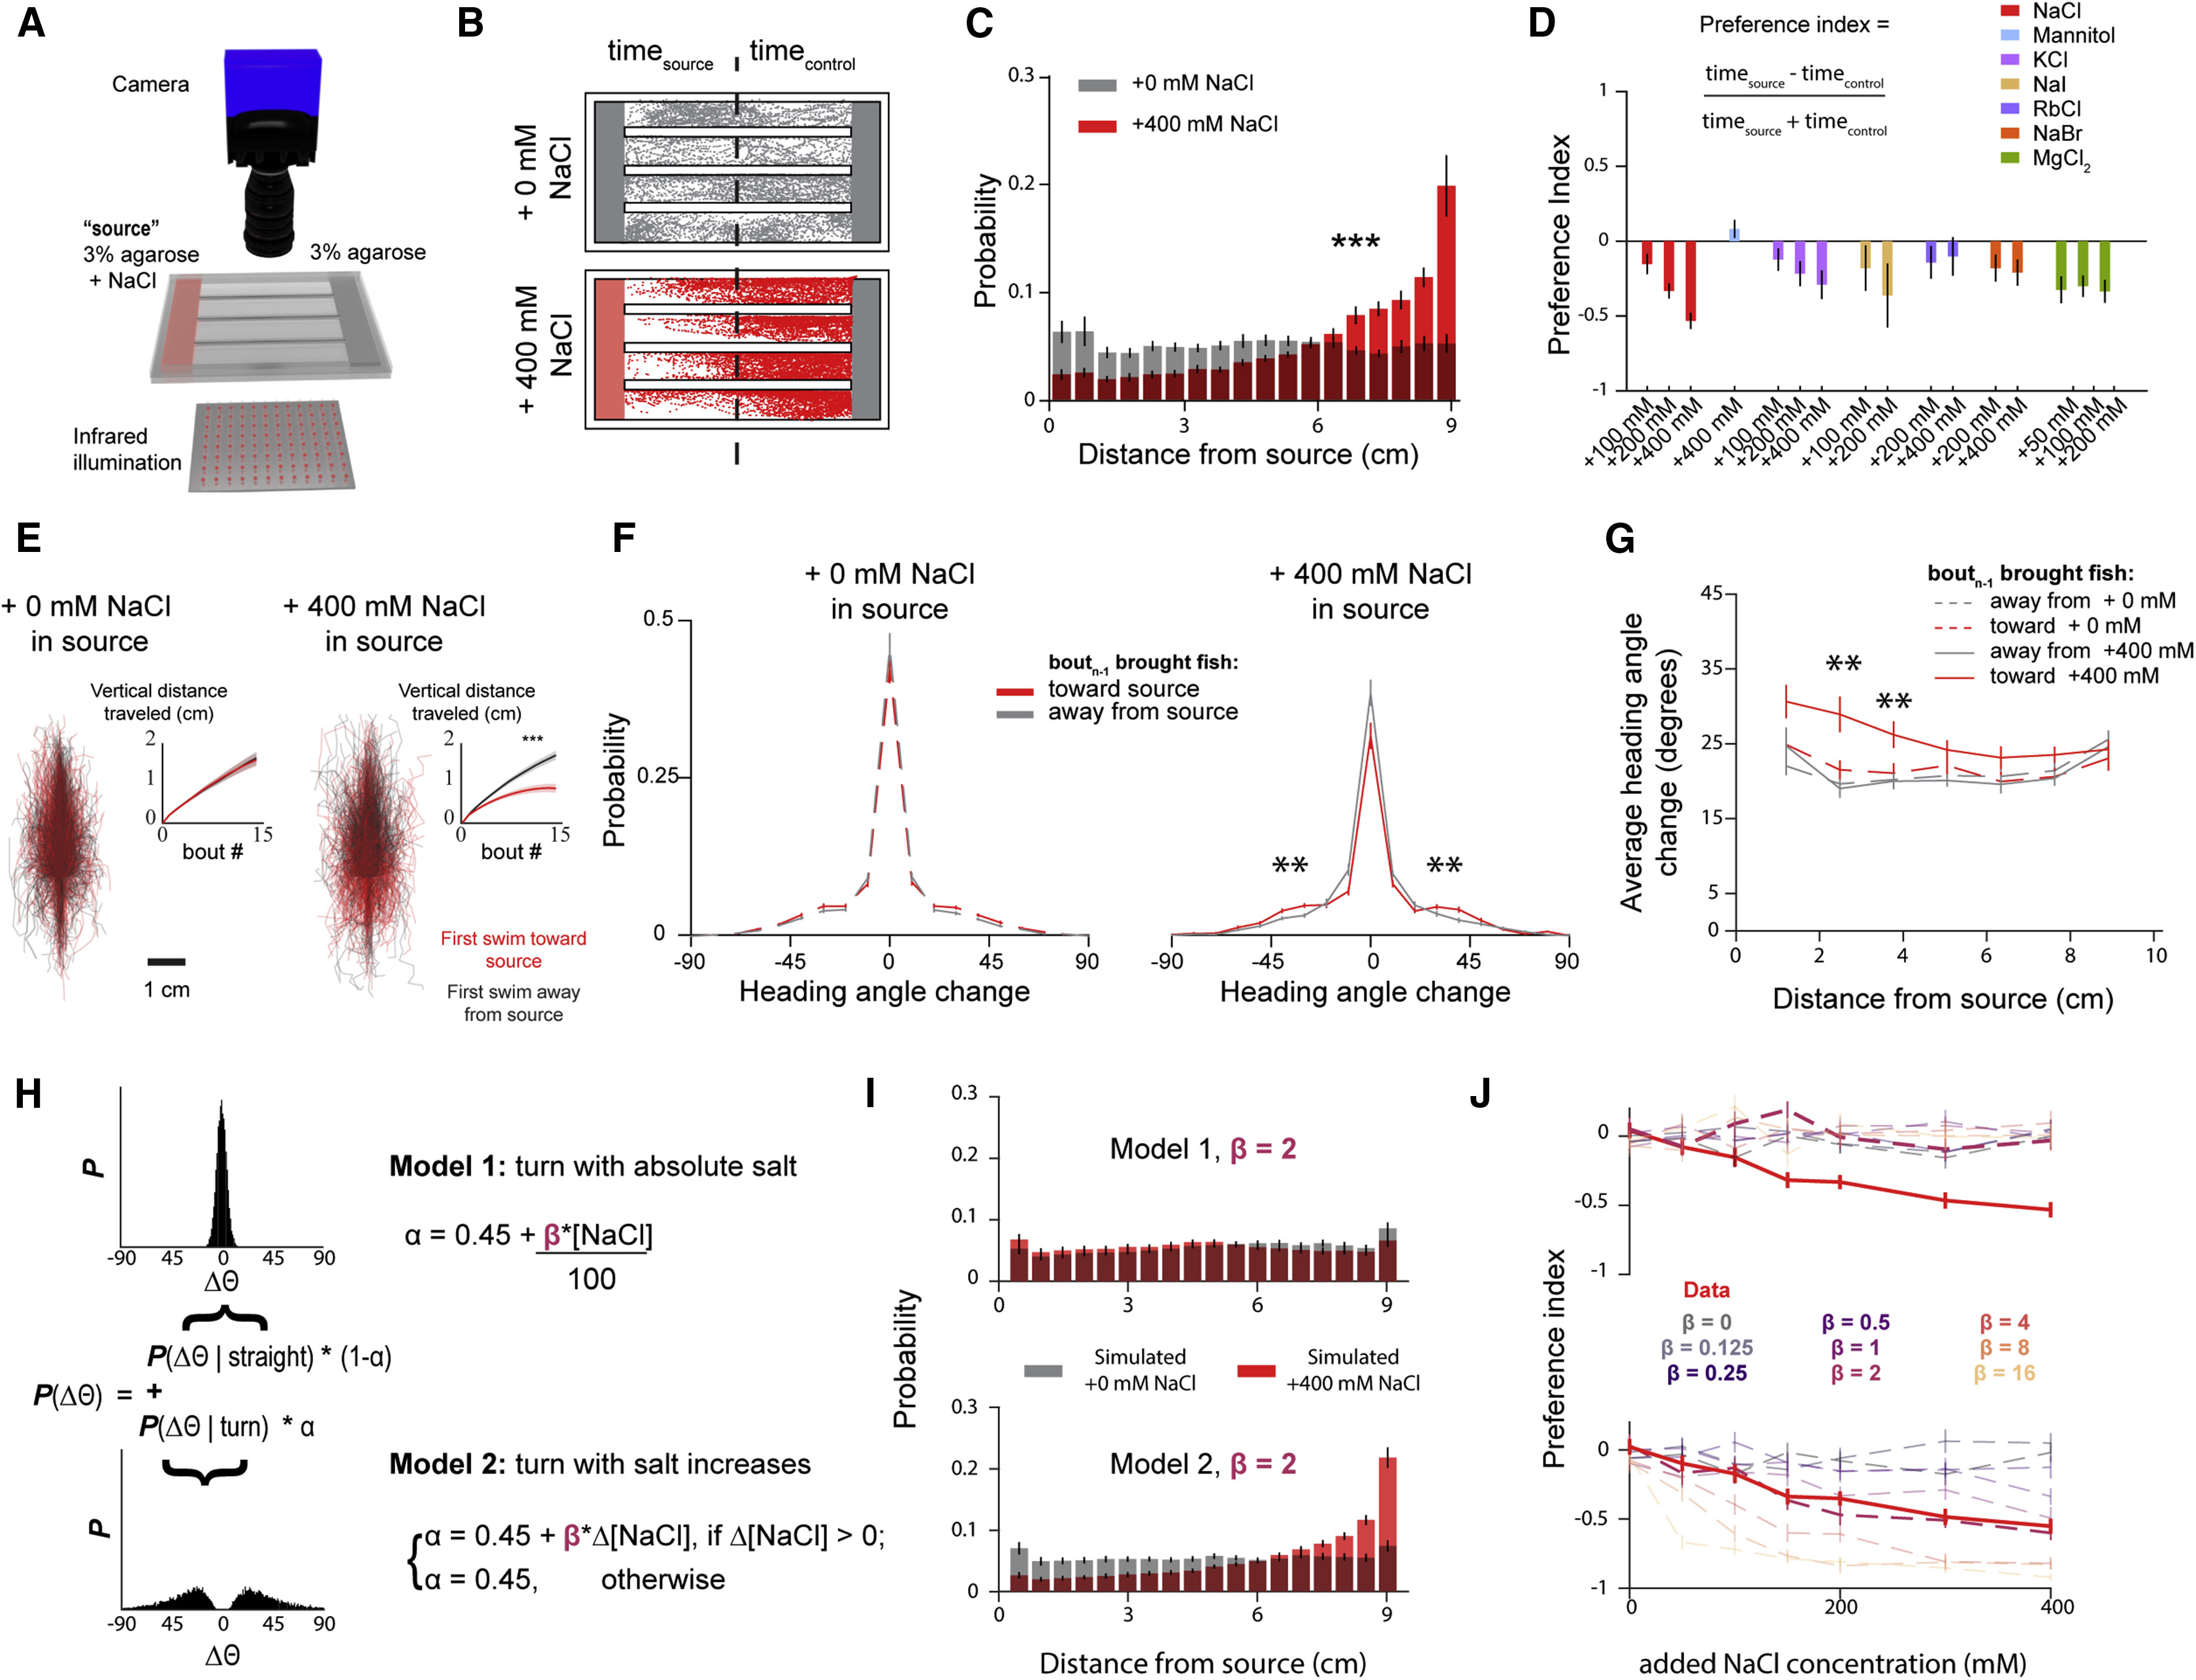
Fig. 1 (A) Schematic of the rig used to perform chemical place preference assays. (B) Sample experiments when 0 mM (top) or 400 mM (bottom) are added to the source agarose. Individual dots demarcate position of larvae at every 50th frame spanning the entire experiment. (C) Histogram of positional occupancy over the entire experiment by larvae when the source gel contains either 0 mM (n = 30) or 400 mM NaCl (n = 24) added (Mann-Whitney U test; p < 0.001) (error bars: mean ± SEM across fish). (D) Preference indices toward different chemical solutions (error bars: mean ± SEM). (E) Individual trajectories of 15 bouts that follow a bout that climbs (red) or descends (gray) gradients with 0 (left) and 400 mM (right) NaCl added to the source. Inset depicts average accumulated distance along the gradient axis in the direction of the first bout (two-sided t test; p < 0.001 for total distance when 400 mM in source; shading indicates SEM). (F) Average turn angle as the larvae swims toward or away from the source as a function of their position in the arena (error bars: mean ± SEM; Bonferroni-corrected t test; p < 0.01). (G) Difference in average turn angle of bouts that follow an increased salt concentration compared to those that follow a decreased salt concentration for different concentrations of source salt (error bars: mean ± SEM; Bonferroni-corrected t test; p < 0.01). (H) Description of the two models being simulated: larvae respond to absolute (model 1) or relative (model 2) salt concentrations. (I) Spatial distribution of larvae in a simulated linear salt gradient when model 1 (top) or model 2 (bottom) are active (error bars: mean ± SEM). (J) Preference indices toward different concentrations of NaCl that result from simulating fish according to both algorithms for a range of salt sensitivities (β) (error bars: mean ± SEM).