
Image
|
Figure Caption
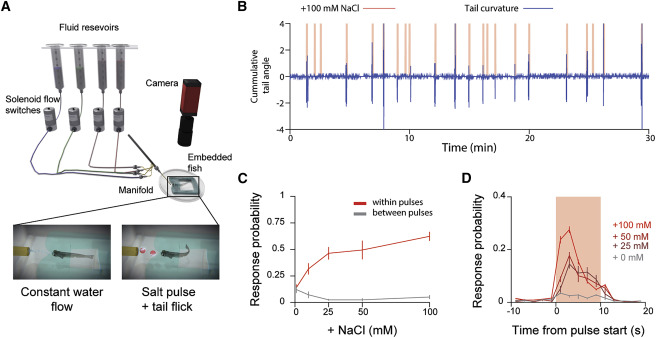
Fig. 2 (A) Schematic of preparation used to stimulate head-embedded larvae. (B) Sample data from an experiment where a larva is stimulated with 10-s pulses of 100 mM NaCl at random intervals. (C) Probability that the larva will exhibit a behavioral response to a pulse of a given NaCl concentration (red) and inter-pulse spontaneous behavior rate (gray) to flowing fish water (error bars: mean ± SEM across fish). (D) Probability of a bout event occurring within 2-s bins for different concentrations of salt relative to the onset of a pulse (error bars: mean ± SEM across fish).
Acknowledgments
This image is the copyrighted work of the attributed author or publisher, and
ZFIN has permission only to display this image to its users.
Additional permissions should be obtained from the applicable author or publisher of the image.
Full text @ Curr. Biol.